Fill in the MATLAB Script file. Thank you


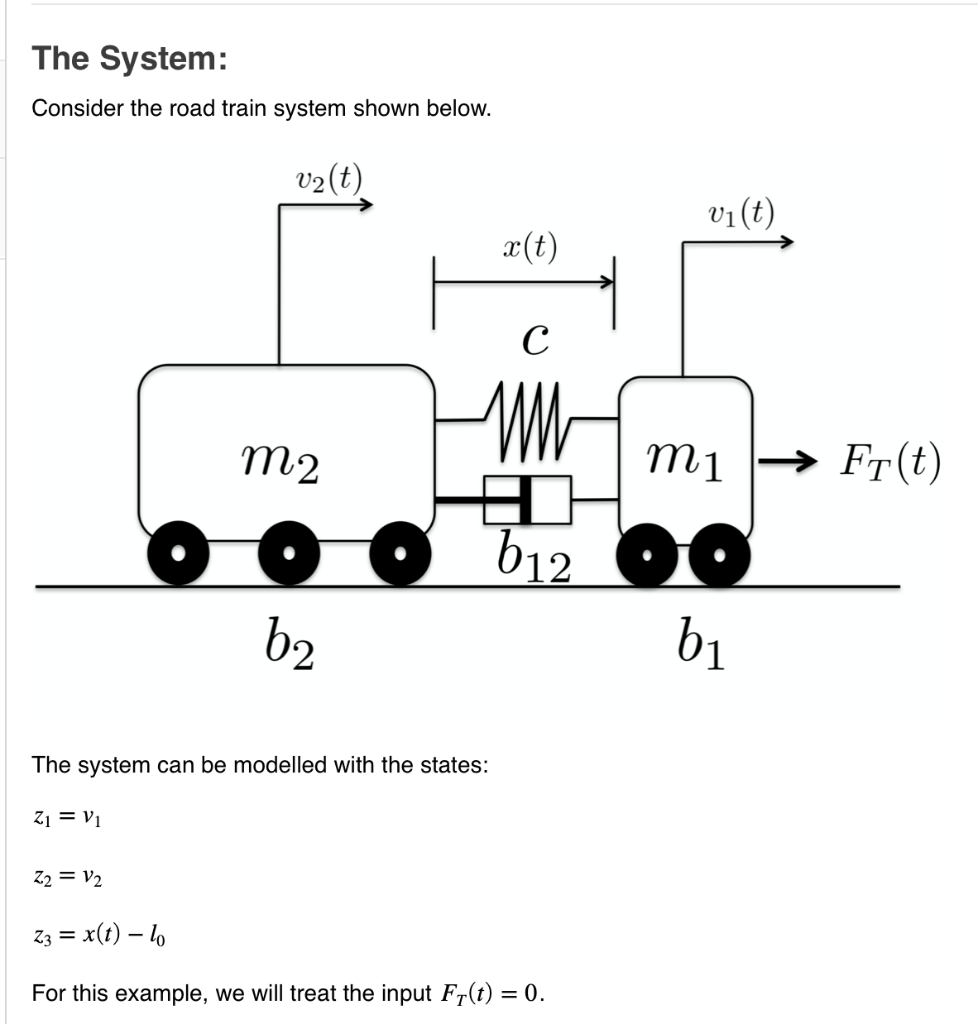
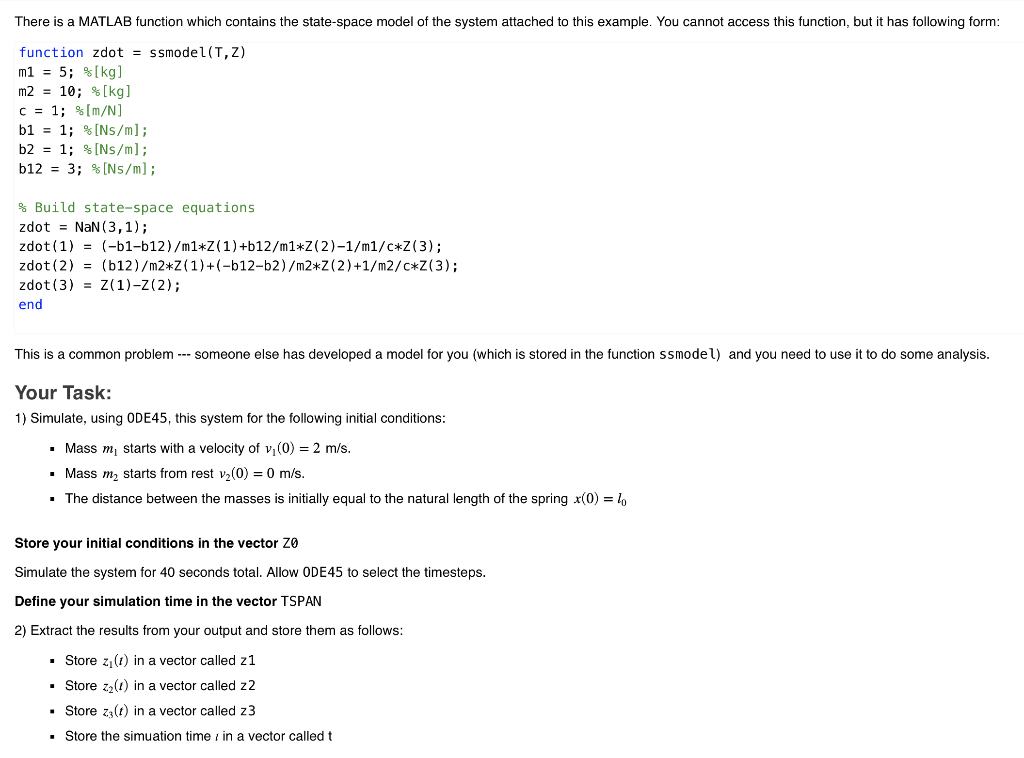
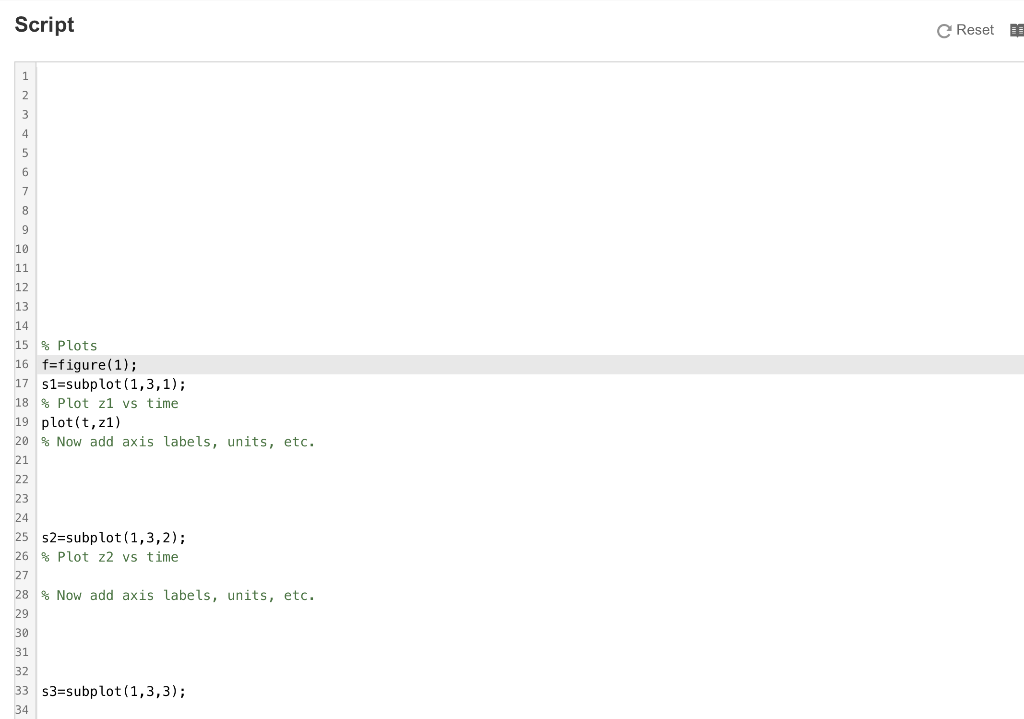
The System: Consider the road train system shown below. v2(t) vi(t) | X(t) Hmmi m2 mi Fr(t) 612 O b2 The system can be modelled with the states: 21 = vi Z2 = V2 z3 = x(t) 10 For this example, we will treat the input Fy(t) = 0. There is a MATLAB function which contains the state-space model of the system attached to this example. You cannot access this function, but it has following form: function zdot = ssmodel(T,Z) m1 = 5; %[kg] m2 = 10; %[kg] C = 1; % (m/N] b1 = 1; % [N/m]; b2 = 1; $[N/m]; b12 = 3; %[N/m]; % Build state-space equations zdot = NaN(3,1); zdot(1) = (-51-b12)/m1*Z(1) +b12/m1*Z(2)-1/m1/C*Z(3); zdot(2) = (b12)/m2*Z(1)+(-b12-62)/m2*2(2)+1/m2/c*Z(3); zdot(3) = 2(1)-2(2); end This is a common problem --- someone else has developed a model for you (which is stored in the function ssmodel) and you need to use it to do some analysis. Your Task: 1) Simulate, using ODE45, this system for the following initial conditions: Mass m, starts with a velocity of v,(0) = 2 m/s. Mass m2 starts from rest v2(0) = 0 m/s. The distance between the masses is initially equal to the natural length of the spring x(0) = lo Store your initial conditions in the vector ZO Simulate the system for 40 seconds total. Allow ODE45 to select the timesteps. Define your simulation time in the vector TSPAN 2) Extract the results from your output and store them as follows: Store z(1) in a vector called z1 Store zz(1) in a vector called z2 Store zz(t) in a vector called 23 Store the simuation time , in a vector called t Script e Reset D2 15 % plots 16 f=figure(1); 17 s1=subplot(1,3,1); 18 % Plot z1 vs time 19 plot(t,z1) 20 % Now add axis labels, units, etc. 25 52=subplot(1,3,2); 26 % Plot 22 vs time % Now add axis labels, units, etc. 33 S3=subplot(1,3,3); The System: Consider the road train system shown below. v2(t) vi(t) | X(t) Hmmi m2 mi Fr(t) 612 O b2 The system can be modelled with the states: 21 = vi Z2 = V2 z3 = x(t) 10 For this example, we will treat the input Fy(t) = 0. There is a MATLAB function which contains the state-space model of the system attached to this example. You cannot access this function, but it has following form: function zdot = ssmodel(T,Z) m1 = 5; %[kg] m2 = 10; %[kg] C = 1; % (m/N] b1 = 1; % [N/m]; b2 = 1; $[N/m]; b12 = 3; %[N/m]; % Build state-space equations zdot = NaN(3,1); zdot(1) = (-51-b12)/m1*Z(1) +b12/m1*Z(2)-1/m1/C*Z(3); zdot(2) = (b12)/m2*Z(1)+(-b12-62)/m2*2(2)+1/m2/c*Z(3); zdot(3) = 2(1)-2(2); end This is a common problem --- someone else has developed a model for you (which is stored in the function ssmodel) and you need to use it to do some analysis. Your Task: 1) Simulate, using ODE45, this system for the following initial conditions: Mass m, starts with a velocity of v,(0) = 2 m/s. Mass m2 starts from rest v2(0) = 0 m/s. The distance between the masses is initially equal to the natural length of the spring x(0) = lo Store your initial conditions in the vector ZO Simulate the system for 40 seconds total. Allow ODE45 to select the timesteps. Define your simulation time in the vector TSPAN 2) Extract the results from your output and store them as follows: Store z(1) in a vector called z1 Store zz(1) in a vector called z2 Store zz(t) in a vector called 23 Store the simuation time , in a vector called t Script e Reset D2 15 % plots 16 f=figure(1); 17 s1=subplot(1,3,1); 18 % Plot z1 vs time 19 plot(t,z1) 20 % Now add axis labels, units, etc. 25 52=subplot(1,3,2); 26 % Plot 22 vs time % Now add axis labels, units, etc. 33 S3=subplot(1,3,3)


