Answered step by step
Verified Expert Solution
Link Copied!

Question

1 Approved Answer

Fill the each table and answer question. c) Fill in the Table below (10 points) Number of Units of output NIPN Real Marginal Real Prot

Fill the each table and answer question.
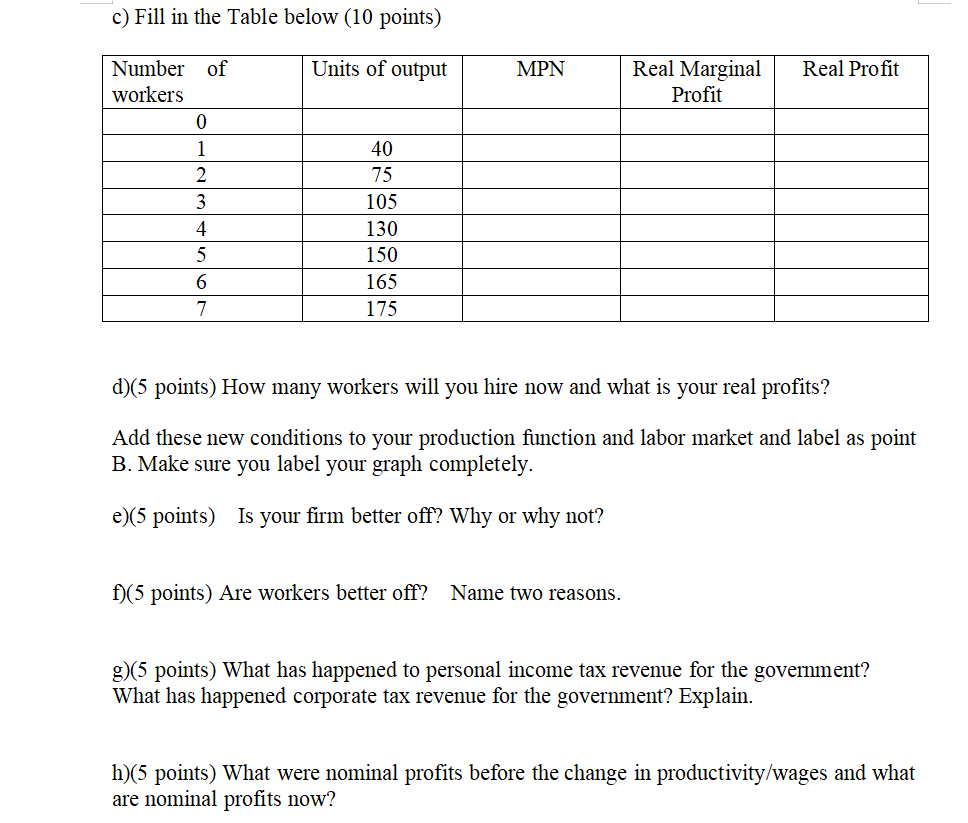
image text in transcribedimage text in transcribed
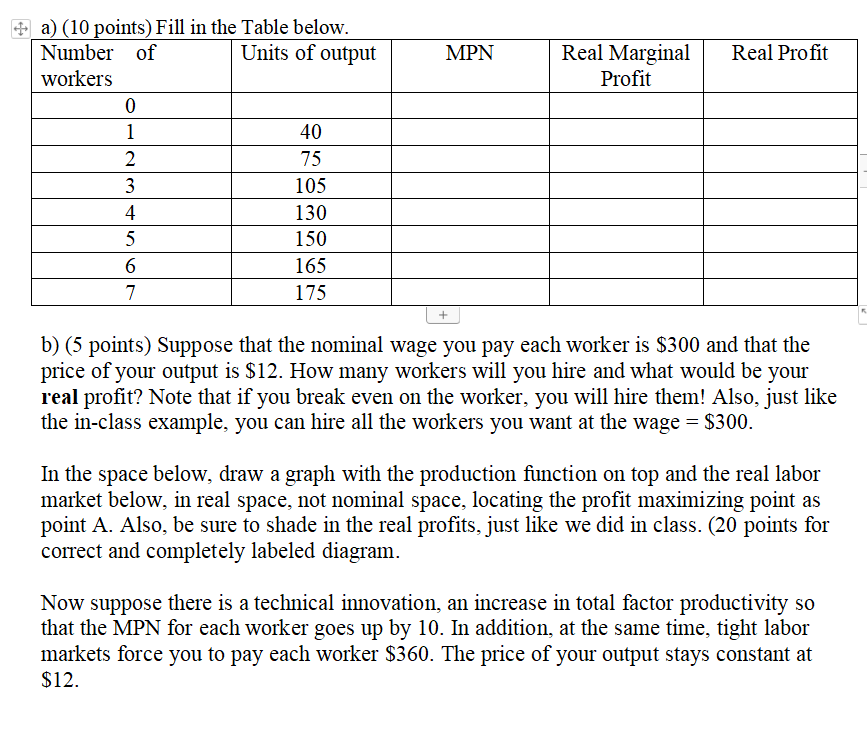
c) Fill in the Table below (10 points) Number of Units of output NIPN Real Marginal Real Prot workers Prot 0 1 40 3 105 4 5 6 7" d)(5 points) How many workers will you hire now and what is your real prots? Add these new conditions to your production function and labor market and label as point B. Make sure you label your graph completely. e)(5 points) Is your rm better off? Why or why not? f)(5 points) Are workers better off? Name two reasons. g)(5 points) What has happened to personal income tax revenue for the government? What has happened corporate tax revenue for the government? Explain. h)(5 points) What were nominal prots before the change in productivityfwages and what are nominal prots now? + a) (10 points) Fill in the Table below. Number of Units of output Real Marginal workers Prot 40 75 MJG'NLh-lh-UJMrID 175 l; b) (5 points) Suppose that the nominal wage you pay each worker is $300 and that the price of your output is $12. How many workers will you hire and what would be your real prot\"? Note that if you break even on the worker, you will hire them! Also, just like the in-class example, you can hire all the workers you want at the wage = $300. In the space below, draw a graph with the production mction on top and the real labor market below, in real space, not nominal space, locating the prot maximizing point as point A. Also, be sure to shade in the real prots, just like we did in class. (20 points for correct and completely labeled diagram. Now suppose there is a technical irmovation, an increase in total factor productivity so that the MPN for each worker goes up by 10. In addition, at the same time, tight labor markets force you to pay each worker $360. The price of your output stays constant at $ 12

Step by Step Solution

There are 3 Steps involved in it

Step: 1

blur-text-image

Get Instant Access to Expert-Tailored Solutions

See step-by-step solutions with expert insights and AI powered tools for academic success

Step: 2

blur-text-image

Step: 3

blur-text-image

Ace Your Homework with AI

Get the answers you need in no time with our AI-driven, step-by-step assistance

Get Started

Recommended Textbook for

Price theory and applications

Authors: Steven E landsburg

8th edition

538746459, 1133008321, 780538746458, 9781133008323, 978-0538746458

More Books

Students also viewed these Economics questions