Question: Filter: draw a curve on the image There are many times where it is useful to draw lines on images, for example to highlight some


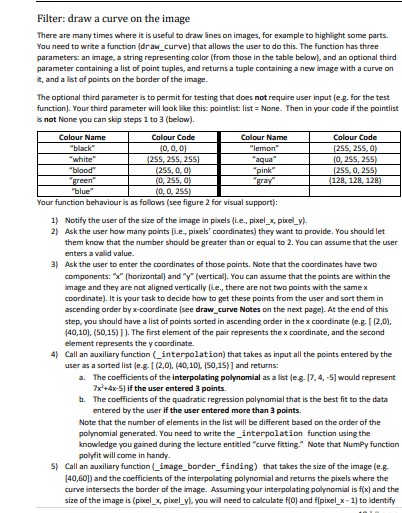
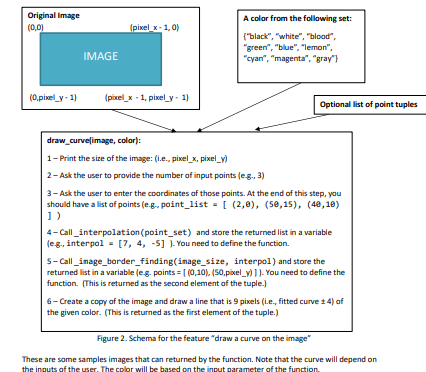
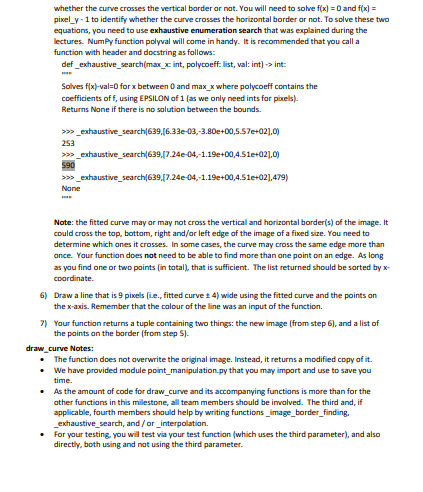
Filter: draw a curve on the image There are many times where it is useful to draw lines on images, for example to highlight some parts. You need to write a function (draw_curve) that allows the user to do this. The function has three parameters: an image, a string representing color (from those in the table below), and an optional third parameter containing a list of point tuples, and returns a tuple containing a new image with a curve on it, and a list of points on the border of the image. The optional third parameter is to permit for testing that does not require user input (e.g. for the test function). Your third parameter will look like this: pointlist: list = None. Then in your code if the pointlist is not None you can skip steps 1 to 3 (below). Colour Name Colour Code Colour Name Colour Code "black" 0, 0, 0] "lemon' 255, 255, ON "white" (2:55, 255, 255] aqua" 0, 235, 295) 'blood" (255, 0, 0) "pink" (255, 0, 295) green 10. 255, 0) "gray (128, 128, 128) "blue" 10, 0, 2951 Your function behaviour is as follows (see figure 2 for visual support): 1) Notify the user of the size of the image in pixels (i.e., pixel_x, pixel_y). 2) Ask the user how many points (Le., pixels' coordinates) they want to provide. You should let them know that the number should be greater than or equal to 2. You can assume that the user enters a valid value. 3) Ask the user to enter the coordinates of those points. Note that the coordinates have two components: ":" (horizontal) and "y" (vertical). You can assume that the points are within the image and they are not aligned vertically [Le., there are not two points with the same x coordinate). It is your task to decide how to get these points from the user and sort them in ascending order by x-coordinate (see draw_curve Notes on the next page]. At the end of this step, you should have a list of points sorted in ascending order in the x coordinate (e.g. [ (2,01, (40,10]. (50,15) ] ]. The first element of the pair represents the x coordinate, and the second element represents the y coordinate. 4) Call an auxiliary function (_interpolation) that takes as input all the points entered by the user as a sorted list le.g. [ (2,01. (40, 10) (50,15) ] and returns: a. The coefficients of the interpolating polynomial as a list (e-g. [7, 4, -5] would represent 7x +4x-5] if the user entered 3 points. b. The coefficients of the quadratic regression polynomial that is the best fit to the data entered by the user if the user entered more than 3 points. Note that the number of elements in the list will be different based on the order of the polynomial generated. You need to write the_interpolation function using the knowledge you gained during the lecture entitled "curve fitting." Note that NumPy function polyfit will come in handy- 5) Call an auxiliary function (image_border_finding) that takes the size of the image (e.g. [40,60]) and the coefficients of the interpolating polynomial and returns the pixels where the curve intersects the border of the image. Assuming your interpolating polynomial is f(x] and the size of the image is (pixel_x, pixel_y). you will need to calculate f(0] and fipixel_x - 1] to identifyOriginal Image A color from the following set: (0,0] (pixel x - 1, 0) ("black", "white", "blood", "green", "blue", "lemon", IMAGE "cyan", "magenta", "gray"} (D,pixel_y - 1) (pixel_x - 1, pixel_y = 1] Optional list of point tuples draw_curve image, color): 1 - Print the size of the image: (i.e., pixel_x, pixel_v) 2 - Ask the user to provide the number of input points (e-g., 3) 3 - Ask the user to enter the coordinates of those points. At the end of this step, you should have a list of points (e.g., point_list = [ (2,0), (50,15), (40,10) 1) 4-Call _interpolation (point_set) and store the returned list in a variable leg, interpol = [7, 4, -5] ]. You need to define the function. 5-Call_image_border_finding(image_size, interpol ) and store the returned list in a variable leg. points = [ (0,10), (50,pixel_v) ] ]- You need to define the function. [This is returned as the second element of the tuple.] 6 - Create a copy of the image and draw a line that is 9 pixels (Le., fitted curve 1 4) of the given color. (This is returned as the first element of the tuple.) Figure 2. Schema for the feature "draw a curve on the image" These are some samples images that can returned by the function. Note that the curve will depend on the inputs of the use ular willl be based on the inout m of the functionwhether the curve crosses the vertical border or not. You will need to solve f(x) = 0 and f(x] = pixel_y - 1 to identify whether the curve crosses the horizontal border or not. To solve these two equations, you need to use exhaustive enumeration search that was explained during the lectures. NumBy function polyval will come in handy. It is recommended that you call a function with header and docstring as follows: def _exhaustive_search(max_x int, polycoeff: list, val: int] -> int: Solves fix)-val=0 for x between 0 and max_x where polycoeff contains the coefficients of f, using EPSILON of 1 [as we only need ints for pixels). Returns None if there is no solution between the bounds. 23p_exhaustive_search(639,[6.33e-03,-3.802+00,5.57e+02],0) 253 232 _exhaustive_search(639,[7.24e-04,-1.192+00,4.51e+02],0) 590 250 _exhaustive_search(639,[7.24e-04,-1.192+00,4.51e+02],479) None Note: the fitted curve may or may not cross the vertical and horizontal border(s) of the image. it could cross the top, bottom, right and/or left edge of the image of a fixed size. You need to determine which ones it crosses. In some cases, the curve may cross the same edge more than once. Your function does not need to be able to find more than one point on an edge. As long as you find one or two points [in total), that is sufficient. The list returned should be sorted by x- coordinate. 5) Draw a line that is 9 pixels [Le., fitted curve 1 4) wide using the fitted curve and the points on the x-axis. Remember that the colour of the line was an input of the function. 7) Your function returns a tuple containing two things: the new image (from step 6], and a list of the points on the border [from step 5]. draw_curve Notes: The function does not overwrite the original image. Instead, it returns a modified copy of it. We have provided module point_manipulation. py that you may import and use to save you time. As the amount of code for draw_curve and its accompanying functions is more than for the other functions in this milestone, all team members should be involved. The third and, if applicable, fourth members should help by writing functions_image_border_finding, _exhaustive_search, and/ or _interpolation. For your testing you will test via your test function (which uses the third parameter), and also directly, both using and not using the third parameter
Step by Step Solution
There are 3 Steps involved in it

Get step-by-step solutions from verified subject matter experts


