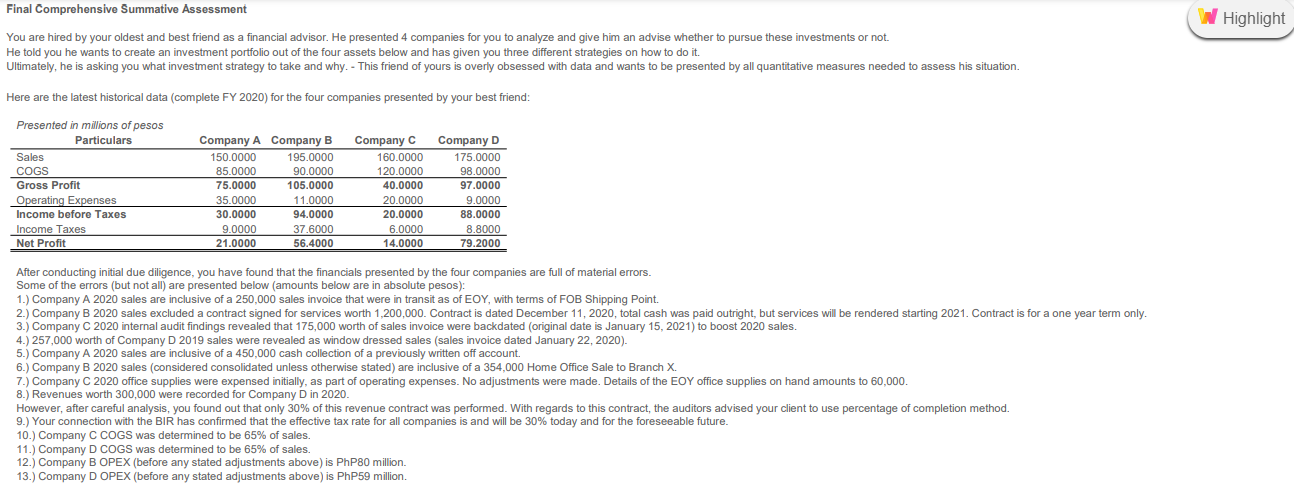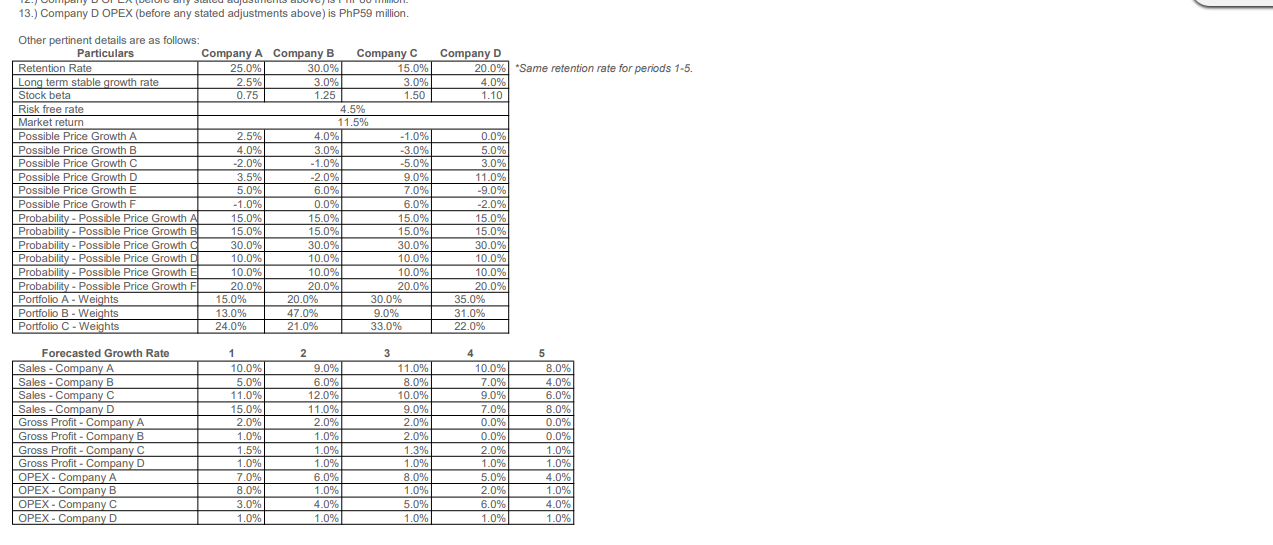

Final Comprehensive Summative Assessment W Highlight You are hired by your oldest and best friend as a financial advisor. He presented 4 companies for you to analyze and give him an advise whether to pursue these investments or not. He told you he wants to create an investment portfolio out of the four assets below and has given you three different strategies on how to do it. Ultimately, he is asking you what investment strategy to take and why. - This friend of yours is overly obsessed with data and wants to be presented by all quantitative measures needed to assess his situation. Here are the latest historical data (complete FY 2020) for the four companies presented by your best friend: Presented in millions of pesos Particulars Sales COGS Gross Profit Operating Expenses Income before Taxes Income Taxes Net Profit Company A Company B 150.0000 195.0000 85.0000 90.0000 75.0000 105.0000 35.0000 11.0000 30.0000 94.0000 9.0000 37.6000 21.0000 56.4000 Company C 160.0000 120.0000 40.0000 20.0000 20.0000 6.0000 14.0000 Company D 175.0000 98.0000 97.0000 9.0000 88.0000 8.8000 79.2000 After conducting initial due diligence, you have found that the financials presented by the four companies are full of material errors. Some of the errors (but not all) are presented below (amounts below are in absolute pesos): 1.) Company A 2020 sales are inclusive of a 250,000 sales invoice that were in transit as of EOY, with terms of FOB Shipping Point. 2.) Company B 2020 sales excluded a contract signed for services worth 1,200,000. Contract is dated December 11, 2020, total cash was paid outright, but services will be rendered starting 2021. Contract is for a one year term only. 3.) Company C 2020 internal audit findings revealed that 175,000 worth of sales invoice were backdated (original date is January 15, 2021) to boost 2020 sales. 4.) 257,000 worth of Company D 2019 sales were revealed as window dressed sales (sales invoice dated January 22, 2020). 5.) Company A 2020 sales are inclusive of a 450,000 cash collection of a previously written off account. 6.) Company B 2020 sales (considered consolidated unless otherwise stated) are inclusive of a 354,000 Home Office Sale Branch X. 7.) Company C 2020 office supplies were expensed initially, as part of operating expenses. No adjustments were made. Details of the EOY office supplies on hand amounts to 60,000 8.) Revenues worth 300,000 were recorded for Company D in 2020. However, after careful analysis, you found out that only 30% of this revenue contract was performed. With regards to this contract, the auditors advised your client to use percentage of completion method. 9.) Your connection with the BIR has confirmed that the effective tax rate for all companies is and will be 30% today and for the foreseeable future. 10.) Company C COGS was determined to be 65% of sales. 11.) Company D COGS was determined to be 65% of sales. 12.) Company B OPEX (before any stated adjustments above) is PhP80 million. 13.) Company D OPEX (before any stated adjustments above) is PhP59 million. 13.) Company D OPEX (before any stated adjustments above) is PhP59 million. Company D 20.0% *Same retention rate for periods 1-5. 4.0% 1.10 Other pertinent details are as follows: Particulars Company A Company B Company C Retention Rate 25.0% 30.0% 15.0% Long term stable growth rate 2.5% 3.0% 3.0% Stock beta 0.75 1.25 1.50 Risk free rate 4.5% Market retum 11.5% Possible Price Growth A 2.5% 4.0% -1.0% Possible Price Growth B 4.0% 3.0% -3.0% Possible Price Growth C -2.0% -1.0% -5.0% Possible Price Growth D 3.5% -2.0% 9.0% Possible Price Growth E 5.0% 6.0% 7.0% Possible Price Growth F -1.0% 0.0% 6.0% Probability - Possible Price Growth A 15.0% 15.0% 15.0% Probability - Possible Price Growth B 15.0% 15.0% 15.0% Probability - Possible Price Growth 30.0% 30.0% 30.0% Probability - Possible Price Growth 10.0% 10.0% 10.0% Probability - Possible Price Growth El 10.0% 10.0% 10.0% Probability - Possible Price Growth 20.0% 20.0% 20.0% Portfolio A. Weights 15.0% 20.0% 30.0% Portfolio B - Weights 13.0% 47.0% 9.0% Portfolio C - Weights 24.0% 21.0% 33.0% 0.0% % 5.0% 3.0% 11.0% -9.0% -2.0% 15.0% 15.0% 30.0% 10.0% 10.0% 20.0% 35.0% 31.0% 22.0% 3 Forecasted Growth Rate Sales - Company A Sales - Company B Sales - Company C Sales - Company D Gross Profit - Company A Gross Profit - Company B Gross Profit - Company C Gross Profit - Company D OPEX - Company A OPEX - Company B OPEX - Company C OPEX - Company D 1 10.0% 5.0% 11.0% 15.0% 2.0% 1.0% 1.5% 1.0% 7.0% 8.0% 3.0% 1.0% 2 9.0% 6.0% 12.0% 11.0% 2.0% 1.0% 1.0% 1.0% 6.0% 1.0% 4.0% 1.0% 11.0% 8.0% 10.0% 9.0% 2.0% 2.0% 1.3% 1.0% 8.0% 1.0% 5.0% 1.0% 4 10.0% 7.0% 9.0% 7.0% 0.0% 0.0% 2.0% 1.0% 5.0% 2.0% 6.0% 1.0% 5 8.0% 4.0% 6.0% 8.0% 0.0% 0.0% 1.0% 1.0% 4.0% 1.0% 4.0% 1.0% Final Comprehensive Summative Assessment W Highlight You are hired by your oldest and best friend as a financial advisor. He presented 4 companies for you to analyze and give him an advise whether to pursue these investments or not. He told you he wants to create an investment portfolio out of the four assets below and has given you three different strategies on how to do it. Ultimately, he is asking you what investment strategy to take and why. - This friend of yours is overly obsessed with data and wants to be presented by all quantitative measures needed to assess his situation. Here are the latest historical data (complete FY 2020) for the four companies presented by your best friend: Presented in millions of pesos Particulars Sales COGS Gross Profit Operating Expenses Income before Taxes Income Taxes Net Profit Company A Company B 150.0000 195.0000 85.0000 90.0000 75.0000 105.0000 35.0000 11.0000 30.0000 94.0000 9.0000 37.6000 21.0000 56.4000 Company C 160.0000 120.0000 40.0000 20.0000 20.0000 6.0000 14.0000 Company D 175.0000 98.0000 97.0000 9.0000 88.0000 8.8000 79.2000 After conducting initial due diligence, you have found that the financials presented by the four companies are full of material errors. Some of the errors (but not all) are presented below (amounts below are in absolute pesos): 1.) Company A 2020 sales are inclusive of a 250,000 sales invoice that were in transit as of EOY, with terms of FOB Shipping Point. 2.) Company B 2020 sales excluded a contract signed for services worth 1,200,000. Contract is dated December 11, 2020, total cash was paid outright, but services will be rendered starting 2021. Contract is for a one year term only. 3.) Company C 2020 internal audit findings revealed that 175,000 worth of sales invoice were backdated (original date is January 15, 2021) to boost 2020 sales. 4.) 257,000 worth of Company D 2019 sales were revealed as window dressed sales (sales invoice dated January 22, 2020). 5.) Company A 2020 sales are inclusive of a 450,000 cash collection of a previously written off account. 6.) Company B 2020 sales (considered consolidated unless otherwise stated) are inclusive of a 354,000 Home Office Sale Branch X. 7.) Company C 2020 office supplies were expensed initially, as part of operating expenses. No adjustments were made. Details of the EOY office supplies on hand amounts to 60,000 8.) Revenues worth 300,000 were recorded for Company D in 2020. However, after careful analysis, you found out that only 30% of this revenue contract was performed. With regards to this contract, the auditors advised your client to use percentage of completion method. 9.) Your connection with the BIR has confirmed that the effective tax rate for all companies is and will be 30% today and for the foreseeable future. 10.) Company C COGS was determined to be 65% of sales. 11.) Company D COGS was determined to be 65% of sales. 12.) Company B OPEX (before any stated adjustments above) is PhP80 million. 13.) Company D OPEX (before any stated adjustments above) is PhP59 million. 13.) Company D OPEX (before any stated adjustments above) is PhP59 million. Company D 20.0% *Same retention rate for periods 1-5. 4.0% 1.10 Other pertinent details are as follows: Particulars Company A Company B Company C Retention Rate 25.0% 30.0% 15.0% Long term stable growth rate 2.5% 3.0% 3.0% Stock beta 0.75 1.25 1.50 Risk free rate 4.5% Market retum 11.5% Possible Price Growth A 2.5% 4.0% -1.0% Possible Price Growth B 4.0% 3.0% -3.0% Possible Price Growth C -2.0% -1.0% -5.0% Possible Price Growth D 3.5% -2.0% 9.0% Possible Price Growth E 5.0% 6.0% 7.0% Possible Price Growth F -1.0% 0.0% 6.0% Probability - Possible Price Growth A 15.0% 15.0% 15.0% Probability - Possible Price Growth B 15.0% 15.0% 15.0% Probability - Possible Price Growth 30.0% 30.0% 30.0% Probability - Possible Price Growth 10.0% 10.0% 10.0% Probability - Possible Price Growth El 10.0% 10.0% 10.0% Probability - Possible Price Growth 20.0% 20.0% 20.0% Portfolio A. Weights 15.0% 20.0% 30.0% Portfolio B - Weights 13.0% 47.0% 9.0% Portfolio C - Weights 24.0% 21.0% 33.0% 0.0% % 5.0% 3.0% 11.0% -9.0% -2.0% 15.0% 15.0% 30.0% 10.0% 10.0% 20.0% 35.0% 31.0% 22.0% 3 Forecasted Growth Rate Sales - Company A Sales - Company B Sales - Company C Sales - Company D Gross Profit - Company A Gross Profit - Company B Gross Profit - Company C Gross Profit - Company D OPEX - Company A OPEX - Company B OPEX - Company C OPEX - Company D 1 10.0% 5.0% 11.0% 15.0% 2.0% 1.0% 1.5% 1.0% 7.0% 8.0% 3.0% 1.0% 2 9.0% 6.0% 12.0% 11.0% 2.0% 1.0% 1.0% 1.0% 6.0% 1.0% 4.0% 1.0% 11.0% 8.0% 10.0% 9.0% 2.0% 2.0% 1.3% 1.0% 8.0% 1.0% 5.0% 1.0% 4 10.0% 7.0% 9.0% 7.0% 0.0% 0.0% 2.0% 1.0% 5.0% 2.0% 6.0% 1.0% 5 8.0% 4.0% 6.0% 8.0% 0.0% 0.0% 1.0% 1.0% 4.0% 1.0% 4.0% 1.0%


