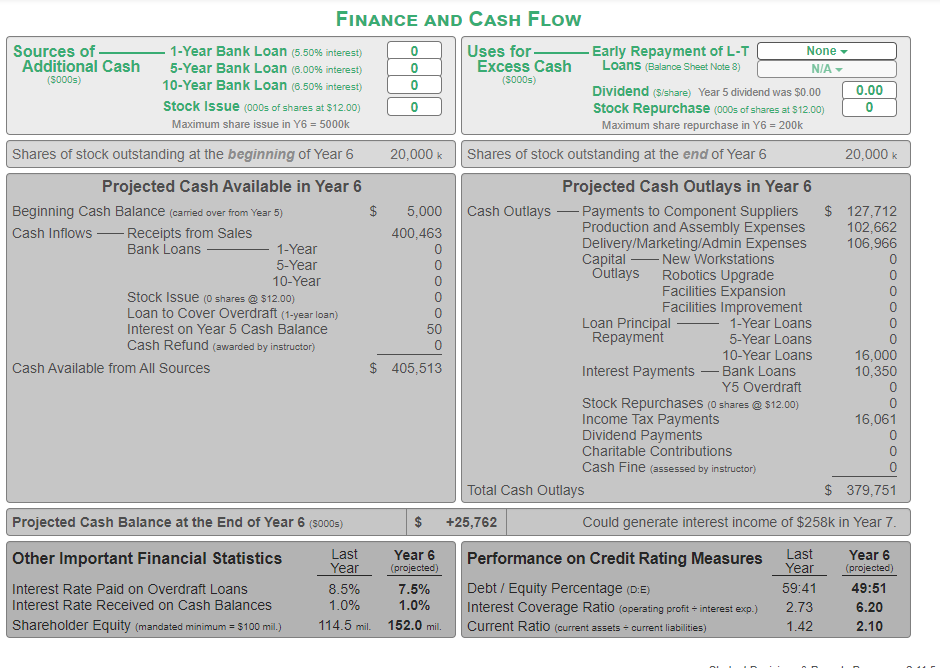
FINANCE AND CASH FLOW Sources of 1-Year Bank Loan (5.50% interest) 0 Uses for -Early Repayment of L-T None - Additional Cash 5-Year Bank Loan (6.00% interest) 0 Excess Cash Loans (Balance Sheet Note 8) NIA- (5000) 10-Year Bank Loan (6.50% interest) 0 (5000s) Dividend (S/share) Year 5 dividend was $0.00 0.00 Stock Issue (000s of shares at $12.00) 0 Stock Repurchase (000s of shares at $12.00) 0 Maximum share issue in Y6 = 5000k Maximum share repurchase in Y6 = 200k Shares of stock outstanding at the beginning of Year 6 20,000 k Shares of stock outstanding at the end of Year 6 20,000 k Projected Cash Available in Year 6 Projected Cash Outlays in Year 6 Beginning Cash Balance (carried over from Year 5) $ 5,000 Cash Outlays Payments to Component Suppliers $ 127,712 Cash Inflows Receipts from Sales 400,463 Production and Assembly Expenses 102,662 Bank Loans 1-Year Delivery/Marketing/Admin Expenses 106,966 5-Year Capital New Workstations 10-Year Outlays Robotics Upgrade Stock Issue (0 shares @ $12.00) Facilities Expansion Loan to Cover Overdraft (1-year loan) Facilities Improvement Interest on Year 5 Cash Balance 50 Loan Principal 1-Year Loans Cash Refund (awarded by instructor) Repayment 5-Year Loans 10-Year Loans 16,000 Cash Available from All Sources $ 405,513 Interest Payments Bank Loans 10,350 Y5 Overdraft 0 Stock Repurchases (Oshares @ $12.00) Income Tax Payments 16,061 Dividend Payments Charitable Contributions Cash Fine (assessed by instructor) Total Cash Outlays $ 379,751 Projected Cash Balance at the End of Year 6 (5000s) $ +25,762 Could generate interest income of $258k in Year 7. Other Important Financial Statistics Interest Rate Paid on Overdraft Loans Interest Rate Received on Cash Balances Shareholder Equity (mandated minimum = $100 mil.) Last Year 8.5% 1.0% 114.5 mil. Year 6 (projected) 7.5% 1.0% 152.0 mil. Performance on Credit Rating Measures Debt / Equity Percentage (D:E) Interest Coverage Ratio (operating profit + interest exp.) Current Ratio (current assets + current liabilities) Last Year 59:41 2.73 1.42 Year 6 (projected) 49:51 6.20 2.10 FINANCE AND CASH FLOW Sources of 1-Year Bank Loan (5.50% interest) 0 Uses for -Early Repayment of L-T None - Additional Cash 5-Year Bank Loan (6.00% interest) 0 Excess Cash Loans (Balance Sheet Note 8) NIA- (5000) 10-Year Bank Loan (6.50% interest) 0 (5000s) Dividend (S/share) Year 5 dividend was $0.00 0.00 Stock Issue (000s of shares at $12.00) 0 Stock Repurchase (000s of shares at $12.00) 0 Maximum share issue in Y6 = 5000k Maximum share repurchase in Y6 = 200k Shares of stock outstanding at the beginning of Year 6 20,000 k Shares of stock outstanding at the end of Year 6 20,000 k Projected Cash Available in Year 6 Projected Cash Outlays in Year 6 Beginning Cash Balance (carried over from Year 5) $ 5,000 Cash Outlays Payments to Component Suppliers $ 127,712 Cash Inflows Receipts from Sales 400,463 Production and Assembly Expenses 102,662 Bank Loans 1-Year Delivery/Marketing/Admin Expenses 106,966 5-Year Capital New Workstations 10-Year Outlays Robotics Upgrade Stock Issue (0 shares @ $12.00) Facilities Expansion Loan to Cover Overdraft (1-year loan) Facilities Improvement Interest on Year 5 Cash Balance 50 Loan Principal 1-Year Loans Cash Refund (awarded by instructor) Repayment 5-Year Loans 10-Year Loans 16,000 Cash Available from All Sources $ 405,513 Interest Payments Bank Loans 10,350 Y5 Overdraft 0 Stock Repurchases (Oshares @ $12.00) Income Tax Payments 16,061 Dividend Payments Charitable Contributions Cash Fine (assessed by instructor) Total Cash Outlays $ 379,751 Projected Cash Balance at the End of Year 6 (5000s) $ +25,762 Could generate interest income of $258k in Year 7. Other Important Financial Statistics Interest Rate Paid on Overdraft Loans Interest Rate Received on Cash Balances Shareholder Equity (mandated minimum = $100 mil.) Last Year 8.5% 1.0% 114.5 mil. Year 6 (projected) 7.5% 1.0% 152.0 mil. Performance on Credit Rating Measures Debt / Equity Percentage (D:E) Interest Coverage Ratio (operating profit + interest exp.) Current Ratio (current assets + current liabilities) Last Year 59:41 2.73 1.42 Year 6 (projected) 49:51 6.20 2.10