
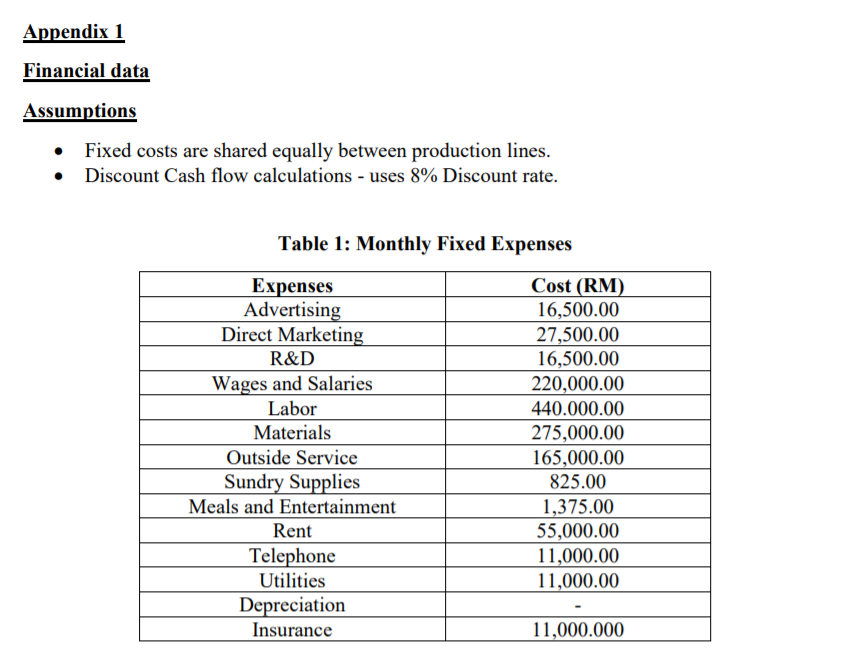
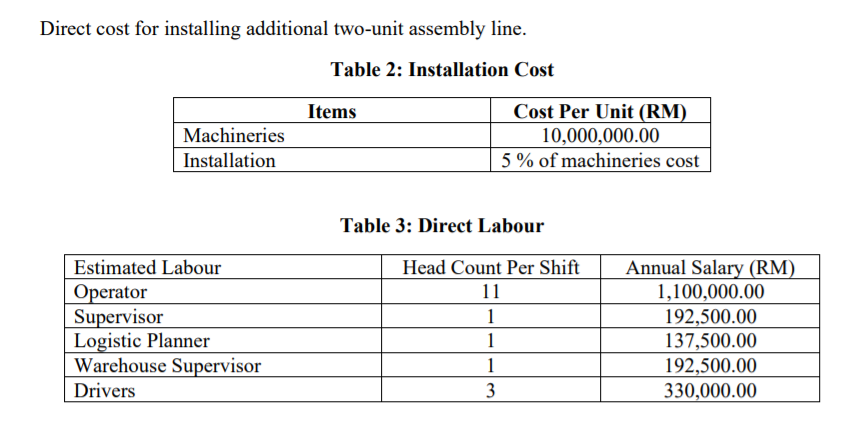
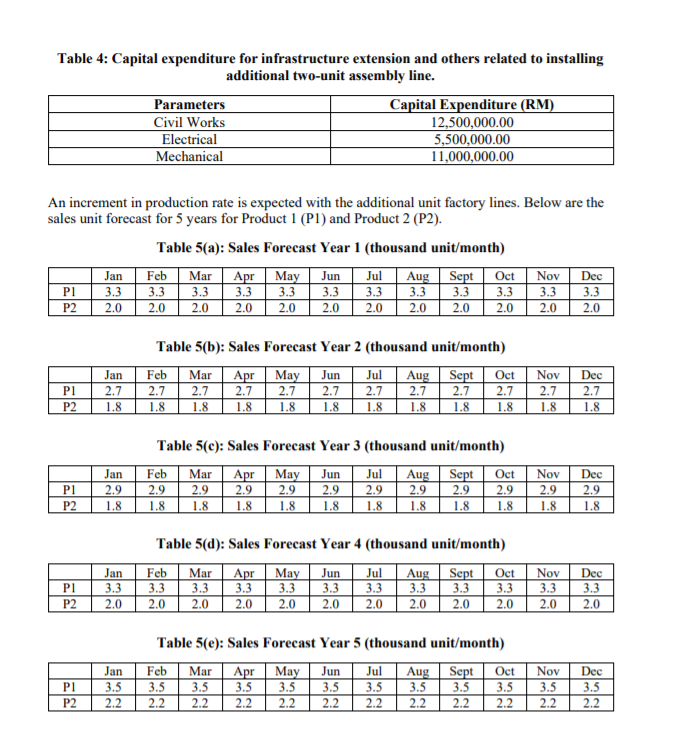
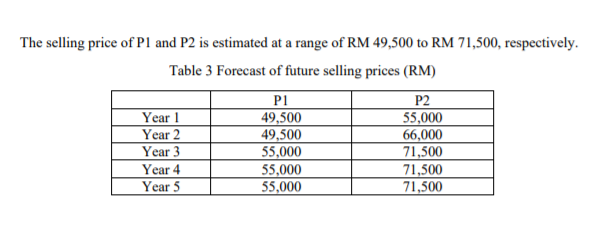
Finance Manager What are the financial implications to the business? What is the current profit/loss status? What will be the profit/loss status after the capacity upgrading? Is the new project viable financially? The cash flow and cost/benefit analysis that clearly articulated the payback period, ROI, NPV etc. is essential in the report and presentation. Appendix 1 Financial data Assumptions Fixed costs are shared equally between production lines. Discount Cash flow calculations - uses 8% Discount rate. Table 1: Monthly Fixed Expenses Expenses Advertising Direct Marketing R&D Wages and Salaries Labor Materials Outside Service Sundry Supplies Meals and Entertainment Rent Telephone Utilities Depreciation Insurance Cost (RM) 16,500.00 27,500.00 16,500.00 220,000.00 440.000.00 275,000.00 165,000.00 825.00 1,375.00 55,000.00 11,000.00 11,000.00 11,000.000 Direct cost for installing additional two-unit assembly line. Table 2: Installation Cost Items Machineries Installation Cost Per Unit (RM) 10,000,000.00 5% of machineries cost Table 3: Direct Labour Estimated Labour Operator Supervisor Logistic Planner Warehouse Supervisor Drivers Head Count Per Shift 11 1 1 1 3 Annual Salary (RM) 1,100,000.00 192,500.00 137,500.00 192,500.00 330,000.00 3 Table 4: Capital expenditure for infrastructure extension and others related to installing additional two-unit assembly line. Parameters Capital Expenditure (RM) Civil Works 12,500,000.00 Electrical 5,500,000.00 Mechanical 11,000,000.00 An increment in production rate is expected with the additional unit factory lines. Below are the sales unit forecast for 5 years for Product 1 (Pl) and Product 2 (P2). Table 5(a): Sales Forecast Year 1 (thousand unit/month) PI P2 Jan 3.3 2.0 Feb 3.3 2.0 Mar 3.3 2.0 Apr 3.3 2.0 May 3.3 2.0 Jun 3.3 2.0 Jul 3.3 2.0 Aug 3.3 2.0 Sept 3.3 2.0 Oct 3.3 2.0 Nov 3.3 2.0 Dec 3.3 2.0 Table 5(b): Sales Forecast Year 2 (thousand unit/month) Feb Mar Apr May Jun Jul Aug Sept Oct 2.7 2.7 2.7 2.7 2.7 2.7 2.7 1.8 1.8 1.8 1.8 1.8 1.8 1.8 Nov Dec Jan 2.7 1.8 PI 2.7 1.8 2.7 1.8 2.7 2.7 1.8 P2 1.8 Table 5(c): Sales Forecast Year 3 (thousand unit/month) Jan 2.9 1.8 Feb 2.9 1.8 Mar 2.9 1.8 Apr 2.9 1.8 May 2.9 1.8 Jun 2.9 1.8 Jul 2.9 1.8 Aug 2.9 1.8 Sept 2.9 1.8 Oct 2.9 1.8 Nov 2.9 1.8 Dec 2.9 1.8 P2 Table 5(d): Sales Forecast Year 4 (thousand unit/month) Jun Oct Dec P1 P2 Jan 3.3 2.0 Feb 3.3 Mar 3.3 2.0 Apr 3.3 May 3.3 2.0 Jul 3.3 2.0 Aug 3.3 2.0 Sept 3.3 2.0 3.3 Nov 3.3 2.0 2.0 2.0 2.0 2.0 2.0 Table 5(e): Sales Forecast Year 5 (thousand unit/month) PI P2 Jan 3.5 2.2 Feb 3.5 2.2 Mar 3.5 2.2 Apr 3.5 2.2 May 3.5 2.2 Jun 3.5 2.2 Jul 3.5 2.2 Aug 3.5 2.2 Sept 3.5 2.2 Oct 3.5 2.2 Nov 3.5 2.2 Dec 3.5 2.2 The selling price of P1 and P2 is estimated at a range of RM 49,500 to RM 71,500, respectively. Table 3 Forecast of future selling prices (RM) P1 P2 Year 1 49,500 55,000 Year 2 49,500 66,000 Year 3 55,000 71,500 Year 4 55,000 71,500 Year 5 55,000 71,500 Finance Manager What are the financial implications to the business? What is the current profit/loss status? What will be the profit/loss status after the capacity upgrading? Is the new project viable financially? The cash flow and cost/benefit analysis that clearly articulated the payback period, ROI, NPV etc. is essential in the report and presentation. Appendix 1 Financial data Assumptions Fixed costs are shared equally between production lines. Discount Cash flow calculations - uses 8% Discount rate. Table 1: Monthly Fixed Expenses Expenses Advertising Direct Marketing R&D Wages and Salaries Labor Materials Outside Service Sundry Supplies Meals and Entertainment Rent Telephone Utilities Depreciation Insurance Cost (RM) 16,500.00 27,500.00 16,500.00 220,000.00 440.000.00 275,000.00 165,000.00 825.00 1,375.00 55,000.00 11,000.00 11,000.00 11,000.000 Direct cost for installing additional two-unit assembly line. Table 2: Installation Cost Items Machineries Installation Cost Per Unit (RM) 10,000,000.00 5% of machineries cost Table 3: Direct Labour Estimated Labour Operator Supervisor Logistic Planner Warehouse Supervisor Drivers Head Count Per Shift 11 1 1 1 3 Annual Salary (RM) 1,100,000.00 192,500.00 137,500.00 192,500.00 330,000.00 3 Table 4: Capital expenditure for infrastructure extension and others related to installing additional two-unit assembly line. Parameters Capital Expenditure (RM) Civil Works 12,500,000.00 Electrical 5,500,000.00 Mechanical 11,000,000.00 An increment in production rate is expected with the additional unit factory lines. Below are the sales unit forecast for 5 years for Product 1 (Pl) and Product 2 (P2). Table 5(a): Sales Forecast Year 1 (thousand unit/month) PI P2 Jan 3.3 2.0 Feb 3.3 2.0 Mar 3.3 2.0 Apr 3.3 2.0 May 3.3 2.0 Jun 3.3 2.0 Jul 3.3 2.0 Aug 3.3 2.0 Sept 3.3 2.0 Oct 3.3 2.0 Nov 3.3 2.0 Dec 3.3 2.0 Table 5(b): Sales Forecast Year 2 (thousand unit/month) Feb Mar Apr May Jun Jul Aug Sept Oct 2.7 2.7 2.7 2.7 2.7 2.7 2.7 1.8 1.8 1.8 1.8 1.8 1.8 1.8 Nov Dec Jan 2.7 1.8 PI 2.7 1.8 2.7 1.8 2.7 2.7 1.8 P2 1.8 Table 5(c): Sales Forecast Year 3 (thousand unit/month) Jan 2.9 1.8 Feb 2.9 1.8 Mar 2.9 1.8 Apr 2.9 1.8 May 2.9 1.8 Jun 2.9 1.8 Jul 2.9 1.8 Aug 2.9 1.8 Sept 2.9 1.8 Oct 2.9 1.8 Nov 2.9 1.8 Dec 2.9 1.8 P2 Table 5(d): Sales Forecast Year 4 (thousand unit/month) Jun Oct Dec P1 P2 Jan 3.3 2.0 Feb 3.3 Mar 3.3 2.0 Apr 3.3 May 3.3 2.0 Jul 3.3 2.0 Aug 3.3 2.0 Sept 3.3 2.0 3.3 Nov 3.3 2.0 2.0 2.0 2.0 2.0 2.0 Table 5(e): Sales Forecast Year 5 (thousand unit/month) PI P2 Jan 3.5 2.2 Feb 3.5 2.2 Mar 3.5 2.2 Apr 3.5 2.2 May 3.5 2.2 Jun 3.5 2.2 Jul 3.5 2.2 Aug 3.5 2.2 Sept 3.5 2.2 Oct 3.5 2.2 Nov 3.5 2.2 Dec 3.5 2.2 The selling price of P1 and P2 is estimated at a range of RM 49,500 to RM 71,500, respectively. Table 3 Forecast of future selling prices (RM) P1 P2 Year 1 49,500 55,000 Year 2 49,500 66,000 Year 3 55,000 71,500 Year 4 55,000 71,500 Year 5 55,000 71,500


