Finance
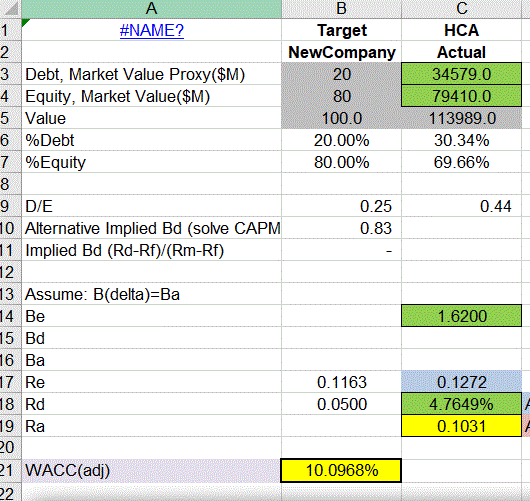
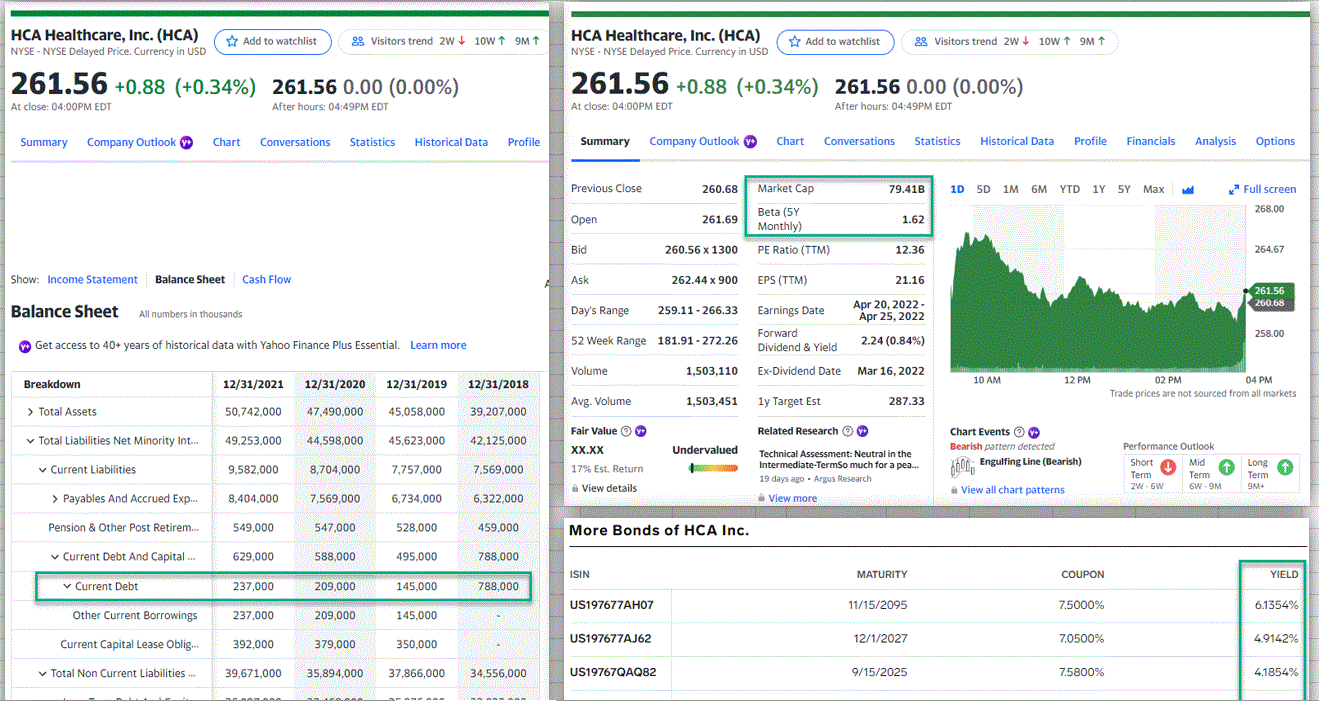
Using that data, please help calculate the R(a). HCA stock.

Zoom in

 Using that da
Market Wide Information Tax 0.21 Rm-Rf 0.06 Debt, Market Value Proxy($M) Equity, Market Value($M) Value %Debt %Equity Target NewCompany 20 80 100.0 20.00% 80.00% Actual 34579.0 79410.0 113989.0 30.34% 69.66% Billion Billion Billion 10y Tbond 1y Tbill 0.03 0.01 0.44 D/E Alternative Implied Bd (solve CAPM Implied Bd (Rd-Rf)/(Rm-Rf) 0.25 0.83 |RA E D -RE+ E + D E + D E RD Beta Assume: B(delta)=Ba Be Re Rd (Bond YTM) Ra 0.1163 0.0500 1.6200 0.1272 4.7649% 0.1031 (Bond YTM) Assume cost of debt of the new company is 7%, tax rate is 21%, Rf is 3% and market risk premium is 6% Assume the new company will have the same asset risk the Rd is 5%, and 20% debt. WACC(adj) 10.0968% Actual 34579.0 79410.0 113989.0 30.34% 69.66% 0.44 A B 1 #NAME? Target 2 NewCompany 3 Debt, Market Value Proxy($M) 20 4 Equity, Market Value($M) 80 5 Value 100.0 6 %Debt 20.00% 7%Equity 80.00% 8 9 D/E 0.25 10 Alternative Implied Bd (solve CAPM 0.83 11 Implied Bd (Rd-Rf)/(Rm-Rf) 12 13 Assume: B(delta)=Ba 14 Be 15 Bd 16 Ba 17 Re 0.1163 18 Rd 0.0500 19 Ra 20 21 WACC(adj) 10.0968% 22 1.6200 0.1272 4.7649% 0.1031 HCA Healthcare, Inc. (HCA) NYSE - NYSE Delayed Price. Currency in USD * Add to watchlist 89 Visitors trend 2w10W 9M HCA Healthcare, Inc. (HCA) NYSE - NYSE Delayed Price. Currency in USD Add to watchlist 28 Visitors trend 2W10W 9M 1 261.56 +0.88 (+0.34%) 261.56 0.00 (0.00%) 261.56 +0.88 (+0.34%) 261.56 0.00 (0.00%) At close: 04:00PM EDT After hours: 04:49PM EDT At close: 04:00PM EDT After hours: 04:49PM EDT Summary Company Outlook Chart Conversations Statistics Historical Data Profile Summary Company Outlook Chart Conversations Statistics Historical Data Profile Financials Analysis Options Previous Close 79.41B 1D 5D 1M 6M YTD 1Y SY Max IM ** Full screen 268.00 Open 260.68 Market Cap 261.69 Beta (5Y Monthly) 260.56 x 1300 x PE Ratio (TTM) 1.62 Bid 12.36 264.67 Show: Income Statement Balance Sheet Cash Flow Ask 262.44 x 900 EPS (TTM) 21.16 261.56 260.68 Balance Sheet Al numbers in thousands Day's Range 259.11 - 266.33 258.00 Get access to 40+ years of historical data with Yahoo Finance Plus Essential. Learn more . 52 Week Range 181.91.272.26 Earnings Date Apr 20, 2022 Apr 25, 2022 Forward 2.24 (0.84%) Dividend & Yield Ex-Dividend Date Mar 16, 2022 Volume 1,503,110 10 AM 12 PM Breakdown 12/31/2021 12/31/2020 12/31/2019 12/31/2018 02 PM 04 PM Trade prices are not sourced from all markets Avg. Volume 1,503,451 1y Target Est 287.33 > Total Assets 50,742,000 47,490,000 45,058,000 39,207,000 Related Research Total Liabilities Net Minority Int... 49,253,000 44,598,000 45,623,000 42,125,000 Fair Value XX.XX Undervalued Chart Events V Bearish parrem detected bholEnguffing Line (Bearish) Current Liabilities 9,582,000 8.704,000 7,757.000 7,569,000 Technical Assessment: Neutral in the Intermediate-Termso much for a pea... 19 days ago - Argus Research View more 17% Est. Return View details Performance Outlook Short Mid Term Term 2W-6W 6W - 9M Long Term 9M+ View all chart patterns > Payables And Accrued Exp... 8,404,000 7,569,000 6,734,000 6,322,000 Pension & Other Post Retirem... 549,000 547,000 528,000 459,000 More Bonds of HCA Inc. Current Debt And Capital ... 629,000 588,000 495.000 788,000 ISIN MATURITY COUPON YIELD Current Debt 237,000 209,000 145,000 788,000 US197677AHO7 11/15/2095 7.5000% 6.1354% Other Current Borrowings 237,000 209,000 145.000 Current Capital Lease Oblig... US197677AJ62 7.0500% 392,000 12/1/2027 4.9142% 379,000 350,000 Total Non Current Liabilities ... 39,671.000 35,894,000 37,866,000 34,556,000 US19767QAQ82 9/15/2025 7.5800% 41854% GALA Market Wide Information Tax 0.21 Rm-Rf 0.06 Debt, Market Value Proxy($M) Equity, Market Value($M) Value %Debt %Equity Target NewCompany 20 80 100.0 20.00% 80.00% Actual 34579.0 79410.0 113989.0 30.34% 69.66% Billion Billion Billion 10y Tbond 1y Tbill 0.03 0.01 0.44 D/E Alternative Implied Bd (solve CAPM Implied Bd (Rd-Rf)/(Rm-Rf) 0.25 0.83 |RA E D -RE+ E + D E + D E RD Beta Assume: B(delta)=Ba Be Re Rd (Bond YTM) Ra 0.1163 0.0500 1.6200 0.1272 4.7649% 0.1031 (Bond YTM) Assume cost of debt of the new company is 7%, tax rate is 21%, Rf is 3% and market risk premium is 6% Assume the new company will have the same asset risk the Rd is 5%, and 20% debt. WACC(adj) 10.0968% Actual 34579.0 79410.0 113989.0 30.34% 69.66% 0.44 A B 1 #NAME? Target 2 NewCompany 3 Debt, Market Value Proxy($M) 20 4 Equity, Market Value($M) 80 5 Value 100.0 6 %Debt 20.00% 7%Equity 80.00% 8 9 D/E 0.25 10 Alternative Implied Bd (solve CAPM 0.83 11 Implied Bd (Rd-Rf)/(Rm-Rf) 12 13 Assume: B(delta)=Ba 14 Be 15 Bd 16 Ba 17 Re 0.1163 18 Rd 0.0500 19 Ra 20 21 WACC(adj) 10.0968% 22 1.6200 0.1272 4.7649% 0.1031 HCA Healthcare, Inc. (HCA) NYSE - NYSE Delayed Price. Currency in USD * Add to watchlist 89 Visitors trend 2w10W 9M HCA Healthcare, Inc. (HCA) NYSE - NYSE Delayed Price. Currency in USD Add to watchlist 28 Visitors trend 2W10W 9M 1 261.56 +0.88 (+0.34%) 261.56 0.00 (0.00%) 261.56 +0.88 (+0.34%) 261.56 0.00 (0.00%) At close: 04:00PM EDT After hours: 04:49PM EDT At close: 04:00PM EDT After hours: 04:49PM EDT Summary Company Outlook Chart Conversations Statistics Historical Data Profile Summary Company Outlook Chart Conversations Statistics Historical Data Profile Financials Analysis Options Previous Close 79.41B 1D 5D 1M 6M YTD 1Y SY Max IM ** Full screen 268.00 Open 260.68 Market Cap 261.69 Beta (5Y Monthly) 260.56 x 1300 x PE Ratio (TTM) 1.62 Bid 12.36 264.67 Show: Income Statement Balance Sheet Cash Flow Ask 262.44 x 900 EPS (TTM) 21.16 261.56 260.68 Balance Sheet Al numbers in thousands Day's Range 259.11 - 266.33 258.00 Get access to 40+ years of historical data with Yahoo Finance Plus Essential. Learn more . 52 Week Range 181.91.272.26 Earnings Date Apr 20, 2022 Apr 25, 2022 Forward 2.24 (0.84%) Dividend & Yield Ex-Dividend Date Mar 16, 2022 Volume 1,503,110 10 AM 12 PM Breakdown 12/31/2021 12/31/2020 12/31/2019 12/31/2018 02 PM 04 PM Trade prices are not sourced from all markets Avg. Volume 1,503,451 1y Target Est 287.33 > Total Assets 50,742,000 47,490,000 45,058,000 39,207,000 Related Research Total Liabilities Net Minority Int... 49,253,000 44,598,000 45,623,000 42,125,000 Fair Value XX.XX Undervalued Chart Events V Bearish parrem detected bholEnguffing Line (Bearish) Current Liabilities 9,582,000 8.704,000 7,757.000 7,569,000 Technical Assessment: Neutral in the Intermediate-Termso much for a pea... 19 days ago - Argus Research View more 17% Est. Return View details Performance Outlook Short Mid Term Term 2W-6W 6W - 9M Long Term 9M+ View all chart patterns > Payables And Accrued Exp... 8,404,000 7,569,000 6,734,000 6,322,000 Pension & Other Post Retirem... 549,000 547,000 528,000 459,000 More Bonds of HCA Inc. Current Debt And Capital ... 629,000 588,000 495.000 788,000 ISIN MATURITY COUPON YIELD Current Debt 237,000 209,000 145,000 788,000 US197677AHO7 11/15/2095 7.5000% 6.1354% Other Current Borrowings 237,000 209,000 145.000 Current Capital Lease Oblig... US197677AJ62 7.0500% 392,000 12/1/2027 4.9142% 379,000 350,000 Total Non Current Liabilities ... 39,671.000 35,894,000 37,866,000 34,556,000 US19767QAQ82 9/15/2025 7.5800% 41854% GALA


 Using that da


