

Answered step by step
Verified Expert Solution
Question
1 Approved Answer
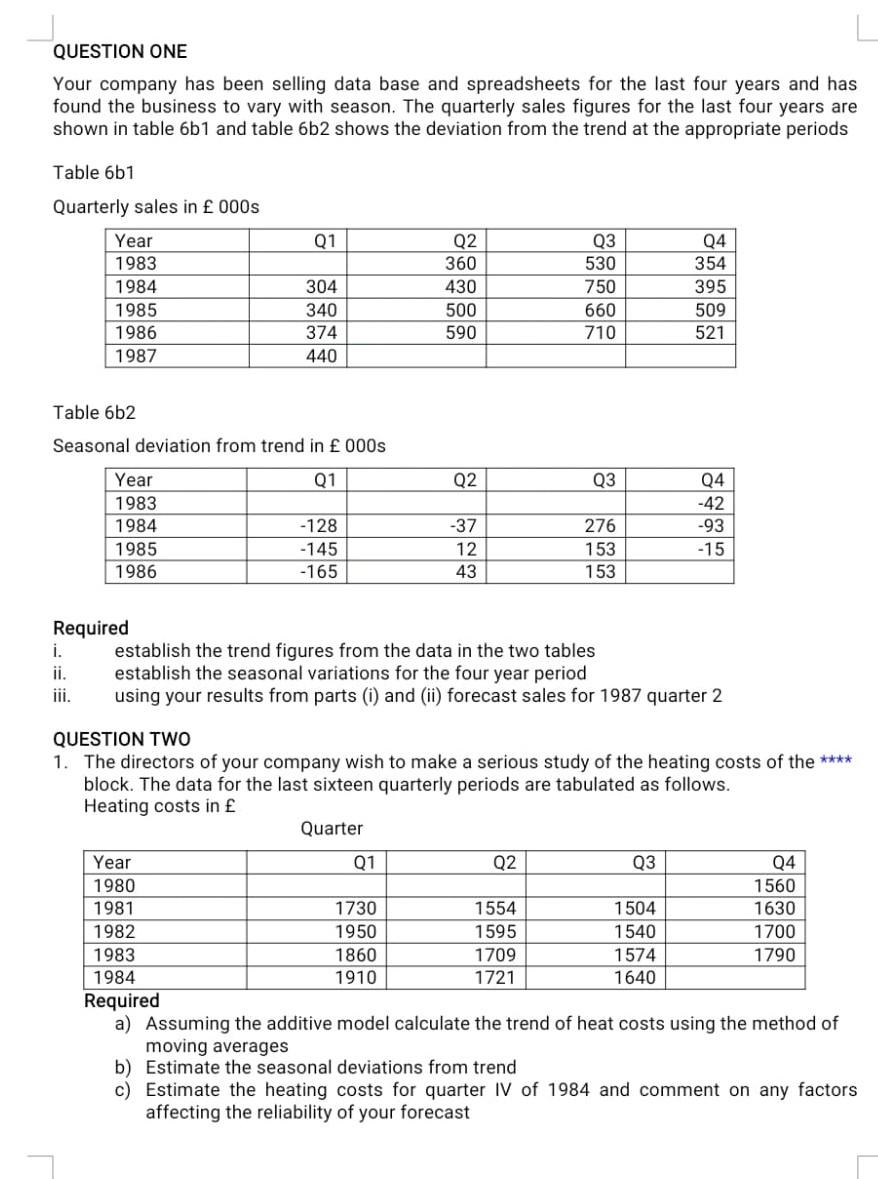
financial analysis and forcasting QUESTION ONE Your company has been selling data base and spreadsheets for the last four years and has found the business
financial analysis and forcasting
QUESTION ONE Your company has been selling data base and spreadsheets for the last four years and has found the business to vary with season. The quarterly sales figures for the last four years are shown in table 6b1 and table 6b2 shows the deviation from the trend at the appropriate periods Table 6b1 Quarterly sales in 000s Q1 Year 1983 1984 1985 1986 1987 304 340 374 440 Q2 360 430 500 590 Q3 530 750 660 710 04 354 395 509 521 Table 6b2 Seasonal deviation from trend in 000s Q1 Q2 03 Year 1983 1984 1985 1986 Q4 -42 -93 -128 -145 -165 -37 12 43 276 153 153 -15 lal Required i. establish the trend figures from the data in the two tables ii. establish the seasonal variations for the four year period iii. using your results from parts (i) and (ii) forecast sales for 1987 quarter 2 QUESTION TWO 1. The directors of your company wish to make a serious study of the heating costs of the **** block. The data for the last sixteen quarterly periods are tabulated as follows. Heating costs in Quarter Year Q1 Q2 Q3 Q4 1980 1560 1981 1730 1554 1504 1630 1982 1950 1595 1540 1700 1983 1860 1709 1574 1790 1984 1910 1721 1640 Required a) Assuming the additive model calculate the trend of heat costs using the method of moving averages b) Estimate the seasonal deviations from trend c) Estimate the heating costs for quarter IV of 1984 and comment on any factors affecting the reliability of your forecast QUESTION ONE Your company has been selling data base and spreadsheets for the last four years and has found the business to vary with season. The quarterly sales figures for the last four years are shown in table 6b1 and table 6b2 shows the deviation from the trend at the appropriate periods Table 6b1 Quarterly sales in 000s Q1 Year 1983 1984 1985 1986 1987 304 340 374 440 Q2 360 430 500 590 Q3 530 750 660 710 04 354 395 509 521 Table 6b2 Seasonal deviation from trend in 000s Q1 Q2 03 Year 1983 1984 1985 1986 Q4 -42 -93 -128 -145 -165 -37 12 43 276 153 153 -15 lal Required i. establish the trend figures from the data in the two tables ii. establish the seasonal variations for the four year period iii. using your results from parts (i) and (ii) forecast sales for 1987 quarter 2 QUESTION TWO 1. The directors of your company wish to make a serious study of the heating costs of the **** block. The data for the last sixteen quarterly periods are tabulated as follows. Heating costs in Quarter Year Q1 Q2 Q3 Q4 1980 1560 1981 1730 1554 1504 1630 1982 1950 1595 1540 1700 1983 1860 1709 1574 1790 1984 1910 1721 1640 Required a) Assuming the additive model calculate the trend of heat costs using the method of moving averages b) Estimate the seasonal deviations from trend c) Estimate the heating costs for quarter IV of 1984 and comment on any factors affecting the reliability of your forecastStep by Step Solution
There are 3 Steps involved in it
Step: 1

Get Instant Access to Expert-Tailored Solutions
See step-by-step solutions with expert insights and AI powered tools for academic success
Step: 2

Step: 3
Ace Your Homework with AI
Get the answers you need in no time with our AI-driven, step-by-step assistance
Get Started
Accountant S Word Search Book Discover Financial Vocabulary And Boost Your Accounting Skills
Authors: Kimmy Publishing
1st Edition
979-8851853371