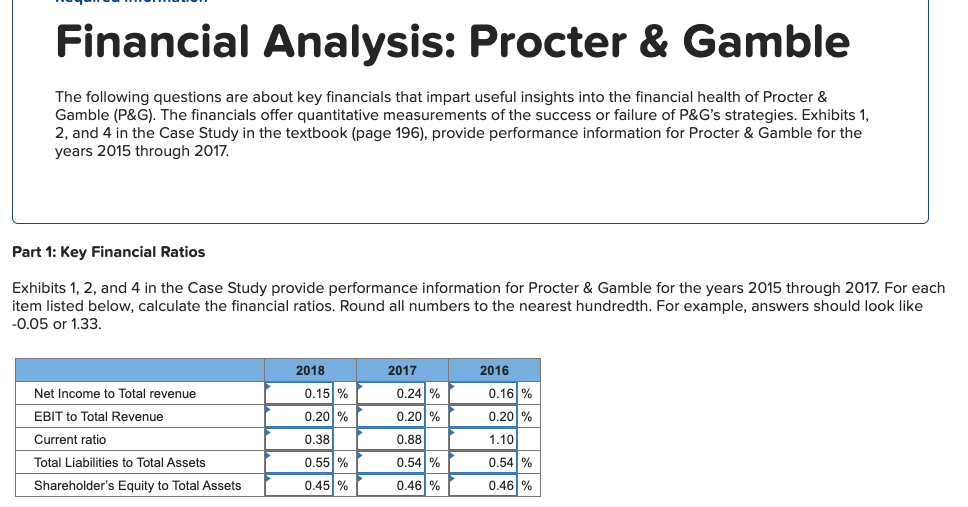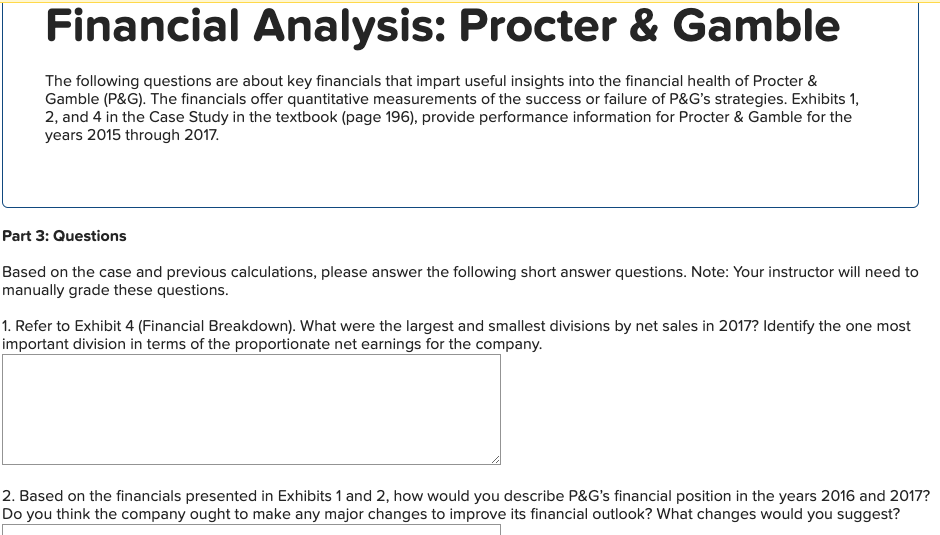


Financial Analysis: Procter & Gamble The following questions are about key financials that impart useful insights into the financial health of Procter & Gamble (P&G). The financials offer quantitative measurements of the success or failure of P&G's strategies. Exhibits 1, 2, and 4 in the Case Study in the textbook (page 196), provide performance information for Procter & Gamble for the years 2015 through 2017. Part 1: Key Financial Ratios Exhibits 1, 2, and 4 in the Case Study provide performance information for Procter & Gamble for the years 2015 through 2017. For each item listed below, calculate the financial ratios. Round all numbers to the nearest hundredth. For example, answers should look like -0.05 or 1.33. Net Income to Total revenue 2018 0.15% 0.20% 0.38 EBIT to Total Revenue Current ratio 2017 0.24% 0.20% 0.88 0.54% 0.46% 2016 0.16% 0.20% 1.10 0.54% Total Liabilities to Total Assets Shareholder's Equity to Total Assets 0.55% 0.45% 0.46% Part 2: Annual Growth Activity Exhibits 1, 2, and 4 in the case provide performance information for Procter & Gamble for the years 2015 through 2017. For each item listed below, calculate the rate of annual growth (or decline) from 2015 to 2016 and for 2016 to 2017. All calculations should be rounded to one decimal (e.g., 12.7%). 2016-2017 -0.41% Revenue Operating Income Net Income Total Assets Total Liabilities Total Stockholder Equity 2017-2018 2.7 % -1.71% -36.0 % -1.7% 1.21% -5.2 % 3.8% 45.31% -5.3% -6.5% -3.8% Financial Analysis: Procter & Gamble The following questions are about key financials that impart useful insights into the financial health of Procter & Gamble (P&G). The financials offer quantitative measurements of the success or failure of P&G's strategies. Exhibits 1, 2, and 4 in the Case Study in the textbook (page 196), provide performance information for Procter & Gamble for the years 2015 through 2017. Part 3: Questions Based on the case and previous calculations, please answer the following short answer questions. Note: Your instructor will need to manually grade these questions. 1. Refer to Exhibit 4 (Financial Breakdown). What were the largest and smallest divisions by net sales in 2017? Identify the one most important division in terms of the proportionate net earnings for the company. 2. Based on the financials presented in Exhibits 1 and 2, how would you describe P&G's financial position in the years 2016 and 2017? Do you think the company ought to make any major changes to improve its financial outlook? What changes would you suggest? Financial Analysis: Procter & Gamble The following questions are about key financials that impart useful insights into the financial health of Procter & Gamble (P&G). The financials offer quantitative measurements of the success or failure of P&G's strategies. Exhibits 1, 2, and 4 in the Case Study in the textbook (page 196), provide performance information for Procter & Gamble for the years 2015 through 2017. Part 1: Key Financial Ratios Exhibits 1, 2, and 4 in the Case Study provide performance information for Procter & Gamble for the years 2015 through 2017. For each item listed below, calculate the financial ratios. Round all numbers to the nearest hundredth. For example, answers should look like -0.05 or 1.33. Net Income to Total revenue 2018 0.15% 0.20% 0.38 EBIT to Total Revenue Current ratio 2017 0.24% 0.20% 0.88 0.54% 0.46% 2016 0.16% 0.20% 1.10 0.54% Total Liabilities to Total Assets Shareholder's Equity to Total Assets 0.55% 0.45% 0.46% Part 2: Annual Growth Activity Exhibits 1, 2, and 4 in the case provide performance information for Procter & Gamble for the years 2015 through 2017. For each item listed below, calculate the rate of annual growth (or decline) from 2015 to 2016 and for 2016 to 2017. All calculations should be rounded to one decimal (e.g., 12.7%). 2016-2017 -0.41% Revenue Operating Income Net Income Total Assets Total Liabilities Total Stockholder Equity 2017-2018 2.7 % -1.71% -36.0 % -1.7% 1.21% -5.2 % 3.8% 45.31% -5.3% -6.5% -3.8% Financial Analysis: Procter & Gamble The following questions are about key financials that impart useful insights into the financial health of Procter & Gamble (P&G). The financials offer quantitative measurements of the success or failure of P&G's strategies. Exhibits 1, 2, and 4 in the Case Study in the textbook (page 196), provide performance information for Procter & Gamble for the years 2015 through 2017. Part 3: Questions Based on the case and previous calculations, please answer the following short answer questions. Note: Your instructor will need to manually grade these questions. 1. Refer to Exhibit 4 (Financial Breakdown). What were the largest and smallest divisions by net sales in 2017? Identify the one most important division in terms of the proportionate net earnings for the company. 2. Based on the financials presented in Exhibits 1 and 2, how would you describe P&G's financial position in the years 2016 and 2017? Do you think the company ought to make any major changes to improve its financial outlook? What changes would you suggest


