Answered step by step
Verified Expert Solution
Question
1 Approved Answer
Financial Analysis Report: Compare the two firms (they are in the same industry) using the 5 ratios over the 5-year period 2013-2017. Do both time
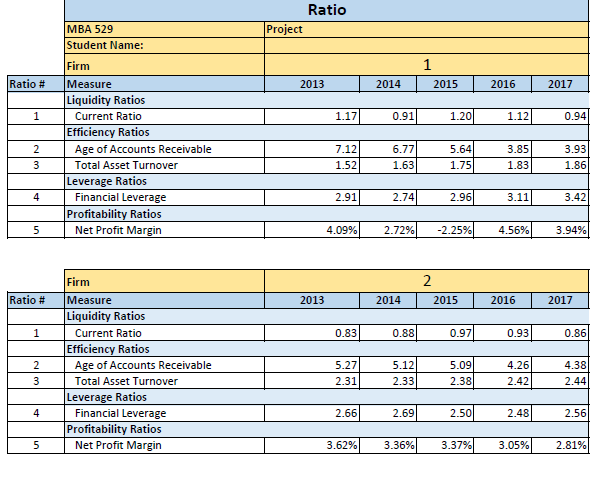
Financial Analysis Report: Compare the two firms (they are in the same industry) using the 5 ratios over the 5-year period 2013-2017. Do both time series analysis and cross sectional analysis using the format below.
Ratio #1 (current ratio)
Firm 1:
Firm 2:
Comparison:
Ratio #2 (Age of AR)
Firm 1:
Firm 2:
Comparison:
And continue with ratio #3 to #5 Please elaborate the answers

Ratio MBA 529 Student Name: Firm Project Ratio # Measure 2013 2014 2015 2016 2017 Liquidity Ratios Current Ratio Efficiency Ratios 1.17 0.91 1.20 1.12 0.94 Age of Accounts Receivable Total Asset Turnover 7.12 1.52 6.77 1.63 5.64 1.75 3.85 1.83 3.93 1.86 Leverage Ratios Financial Leverage 2.91 2.74 2.96 3.11 3.42 Profitability Ratios Net Profit Mar 4,09% 2.72% 2.25% 4.56% 3.94% Firm 2 Ratio # Measure 2013 2014 2015 2016 2017 Liquidity Ratios 0.83 0.88 0.97 0.93 0.86 Current Ratio Effici Ratios Age of Accounts Receivable Total Asset Turnover 5.27 2.31 4.26 2.42 4.38 2.44 5.12 5.09 2.33 2.38 Leverage Ratios Financial Leverage 2.66 2.69 2.50 2.48 2.56 Profitability Ratios Net Profit Margin 3.62% 3.36% 3.37% 3.05% 2.81%
Step by Step Solution
There are 3 Steps involved in it
Step: 1

Get Instant Access to Expert-Tailored Solutions
See step-by-step solutions with expert insights and AI powered tools for academic success
Step: 2

Step: 3

Ace Your Homework with AI
Get the answers you need in no time with our AI-driven, step-by-step assistance
Get Started


