

Answered step by step
Verified Expert Solution
Question
1 Approved Answer
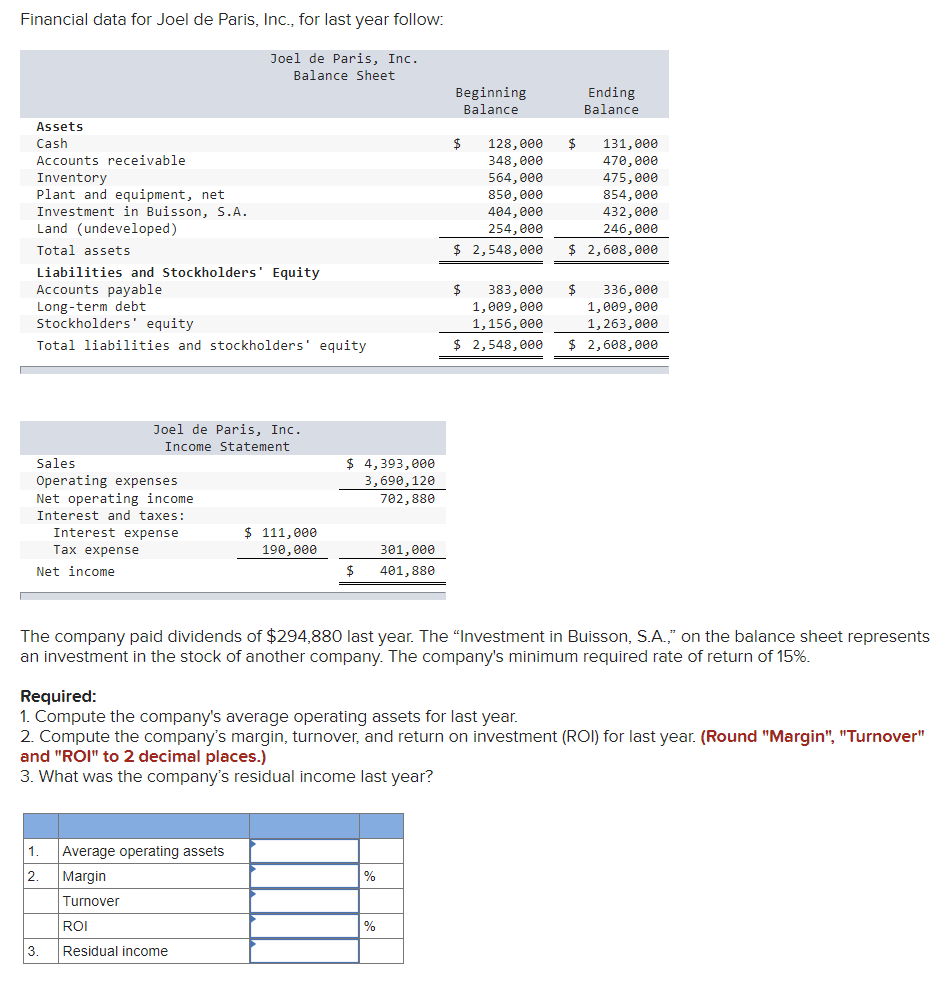
Financial data for Joel de Paris, Inc., for last year follow: Joel de Paris, Inc. Balance Sheet Beginning Balance Ending Balance Assets Cash Accounts receivable
Step by Step Solution
There are 3 Steps involved in it
Step: 1

Get Instant Access to Expert-Tailored Solutions
See step-by-step solutions with expert insights and AI powered tools for academic success
Step: 2

Step: 3
Ace Your Homework with AI
Get the answers you need in no time with our AI-driven, step-by-step assistance
Get Started
The Organisational Change Audit
Authors: Ralph Houston
1st Edition
1907766014, 978-1907766015