Question
Your report will include the ratio results plus an explanation and analysis of each ratio. Include the ratio, its results, and what the results mean
Your report will include the ratio results plus an explanation and analysis of each ratio. Include the ratio, its results, and what the results mean for the company. (Liquidity and Debt, Asset Management, Profitability, and Market ratios. See ratio detail below.) Were there changes in the ratios? What could have caused the change? You must include an evaluation section of what each type of (LAPM) ratio means over the three years, then an overall comparison to validate your conclusion. (Show you understand and know the ratios.)
Financial History: (3-year analysis of the company’s performance.


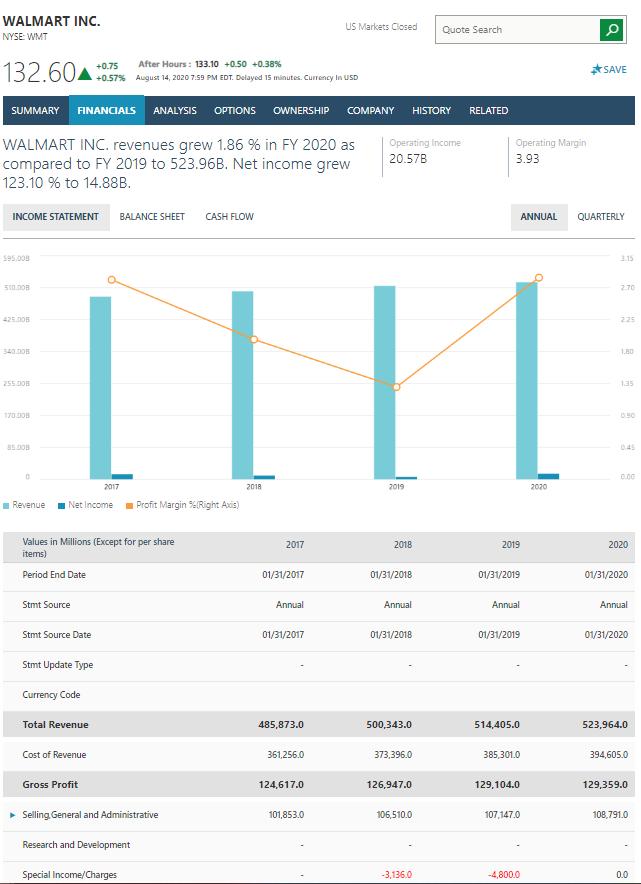
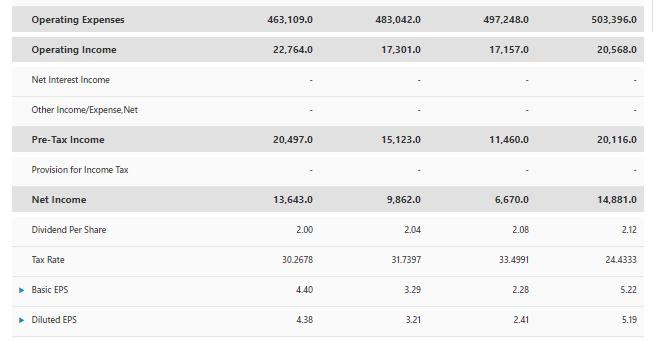
WALMART INC. US Markets Closed Quote Search NYSE: WMT 132.60A +0.75 +0.57% August 14, 2020 7.59 PM EDT. Delayed 15 minutes. Currency In USD After Hours: 133.10 +0.50 +0.38% *SAVE SUMMARY FINANCIALS ANALYSIS OPTIONS OWNERSHIP COMPANY HISTORY RELATED Operating Margin 3.93 WALMART INC. revenues grew 1.86 % in FY 2020 as compared to FY 2019 to 523.96B. Net income grew 123.10 % to 14.88B. Operating Income 20.57B INCOME STATEMENT BALANCE SHEET CASH FLOW ANNUAL QUARTERLY S95,009 3.15 2.70 425.008 225 340.008 180 135 170.O8 045 C.00 2017 2018 2019 2020 Revenue Net Income Profit Margin %Right Avis) Values in Millions (Except for per share items) 2017 2018 2019 2020 Period End Date 01/31/2017 01/31/2018 01/31/2019 01/31/2020 Stmt Source Annual Annual Annual Annual Stmt Source Date 01/31/2017 01/31/2018 01/31/2019 01/31/2020 Stmt Update Type Currency Code Total Revenue 485,873.0 500,343.0 514,405.0 523,964.0 Cost of Revenue 361,256.0 373,396.0 385,301.0 394,605.0 Gross Profit 124,617.0 126,947.0 129,104.0 129,359.0 Selling General and Administrative 101,853.0 106,510.0 107,147.0 108,791.0 Research and Development Special Income/Charges -3,136.0 -4,800.0 0.0
Step by Step Solution
3.40 Rating (163 Votes )
There are 3 Steps involved in it
Step: 1
ANSWER STEP 1 TABLE OF CONTENT Introduction to the company Liquidity and Debt Ratios Asset Management Ratios Profitability Ratios Market Ratios Evaluation of the ratios Conclusion STEP 2 Introduction ...
Get Instant Access to Expert-Tailored Solutions
See step-by-step solutions with expert insights and AI powered tools for academic success
Step: 2

Step: 3

Ace Your Homework with AI
Get the answers you need in no time with our AI-driven, step-by-step assistance
Get Started


