Answered step by step
Verified Expert Solution
Question
1 Approved Answer
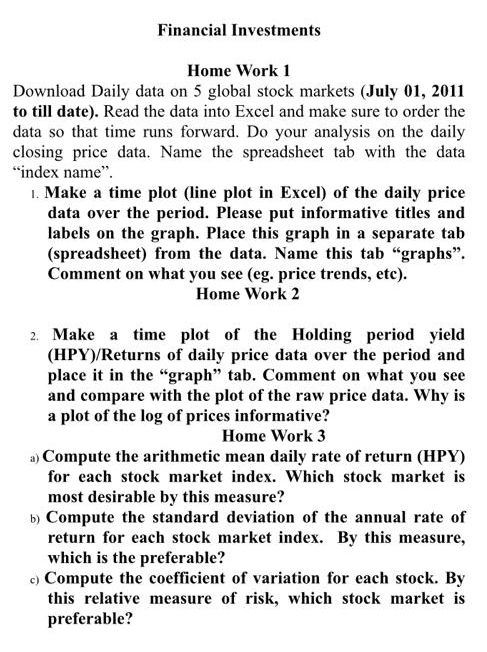
Financial Investments Home Work 1 Download Daily data on 5 global stock markets ( July 0 1 , 2 0 1 1 to till date
Financial Investments
Home Work
Download Daily data on global stock markets July to till date Read the data into Excel and make sure to order the data so that time runs forward. Do your analysis on the daily closing price data. Name the spreadsheet tab with the data "index name".
Make a time plot line plot in Excel of the daily price data over the period. Please put informative titles and labels on the graph. Place this graph in a separate tab spreadsheet from the data. Name this tab "graphs". Comment on what you see eg price trends, etc
Home Work
Make a time plot of the Holding period yield HPYReturns of daily price data over the period and place it in the "graph" tab. Comment on what you see and compare with the plot of the raw price data. Why is a plot of the log of prices informative?
Home Work
a Compute the arithmetic mean daily rate of return HPY for each stock market index. Which stock market is most desirable by this measure?
b Compute the standard deviation of the annual rate of return for each stock market index. By this measure, which is the preferable?
c Compute the coefficient of variation for each stock. By this relative measure of risk, which stock market is preferable?

Step by Step Solution
There are 3 Steps involved in it
Step: 1

Get Instant Access to Expert-Tailored Solutions
See step-by-step solutions with expert insights and AI powered tools for academic success
Step: 2

Step: 3

Ace Your Homework with AI
Get the answers you need in no time with our AI-driven, step-by-step assistance
Get Started


