

Answered step by step
Verified Expert Solution
Question
1 Approved Answer
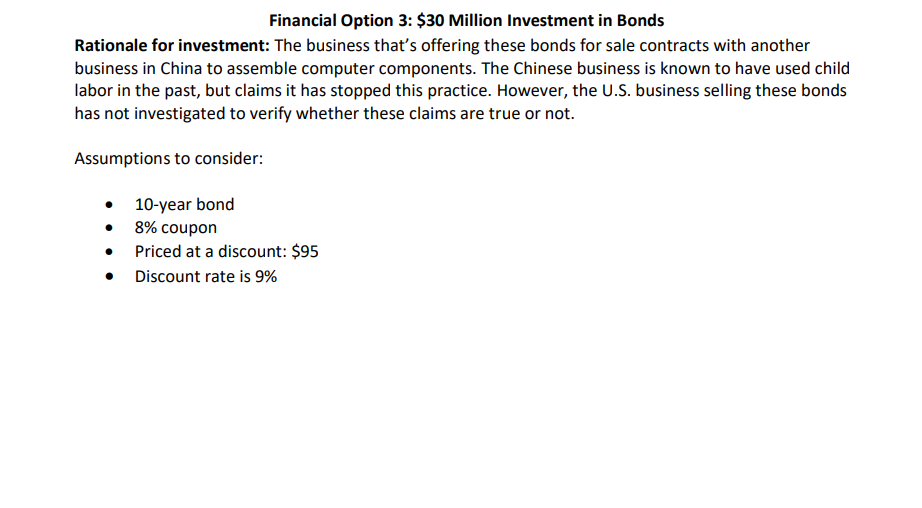
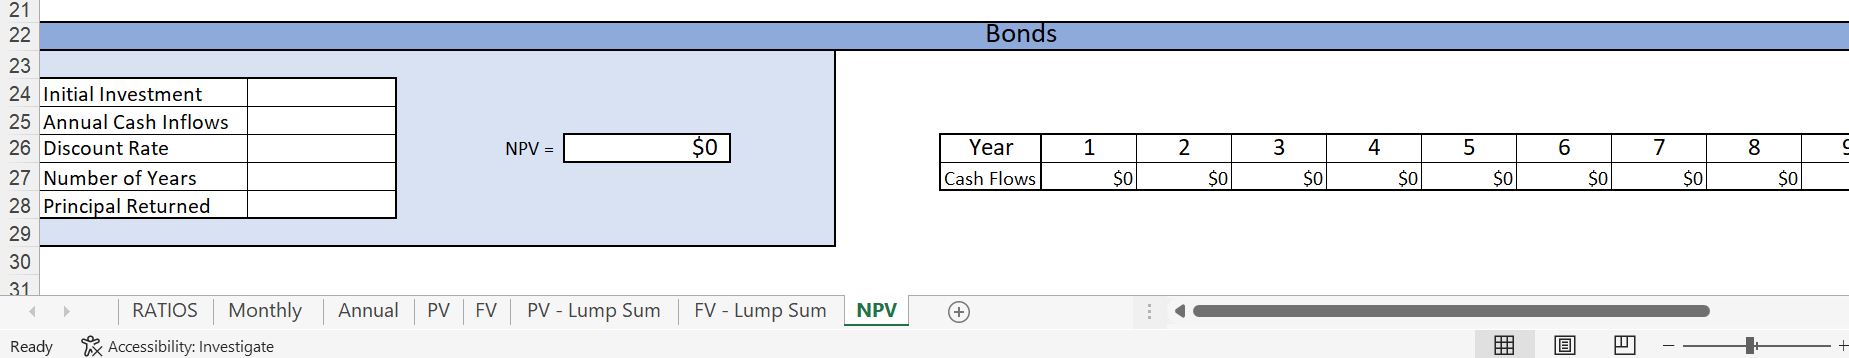
Financial Option 3: $30 Million Investment in Bonds Rationale for investment: The business that's offering these bonds for sale contracts with another business in China
Step by Step Solution
There are 3 Steps involved in it
Step: 1

Get Instant Access to Expert-Tailored Solutions
See step-by-step solutions with expert insights and AI powered tools for academic success
Step: 2

Step: 3
Ace Your Homework with AI
Get the answers you need in no time with our AI-driven, step-by-step assistance
Get Started
Hedge Fund Course
Authors: Stuart A. Mccrary
1st Edition
B0088OYKSS