Financial ratios are helpful for analyzing the company's financial condition and performance. "Evaluate the company for the years 2019 and 2018."
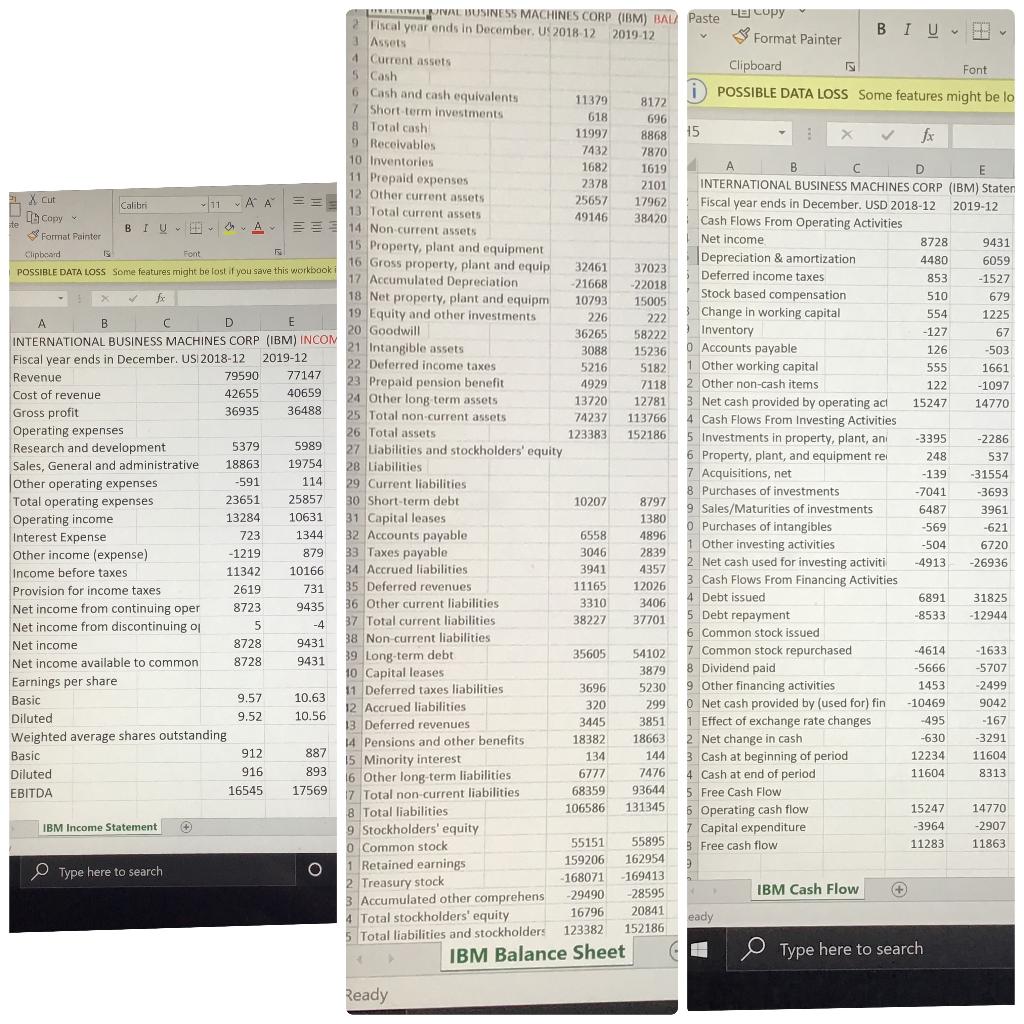
I chose "International Business Machine Corp. (IBM)"
i) Calculate the liquidity, leverage, turnover, profitability, and market value ratios for the most recent two years (check the fiscal year and month.). In total, you should calculate 20 (ratios)x 2 (years) = 40 ratios. Please also provide the formulas and the numbers you use to calculate each ratio
. ***Note*** To calculate market value ratios, you will need the number of shares outstanding for that year. On the income statements, you will see the number of weighted average shares outstanding in two versions, basic and diluted. Please use the basic shares.
ii) Please provide sufficient interpretations of the ratios and explain their change (or no change) from the year before for all the ratios. If there's anything unusual or notable, please explain. Please be cautious about the signs on financial statement figures, especially on the income and cash flow statement. Some companies choose to report expense items as negative numbers because they get subtracted from the revenue to obtain the net income. When calculating the ratios, use your judgment to adjust their signs appropriately.
iii) Please show the formulas (with actual numbers used) for all 20 ratios for just one year.
iv) After calculating all the ratios, please decompose the company's profitability over the two years using the Dupont analysis. Explain the composition of the profitability for your company. Has each component of Dupont increased or decreased from the previous year? How has that affected the company's overall profitability is there any room for improvements?
L X Cut ste SILIWNERAL BUSINESS MACHINES CORP (IBM) BALZ Paste LE Copy 2 Fiscal year ends in December. U 2018 12 2019-12 BIU & Format Painter 3 Assets 4 Current assets Clipboard 5 Cash Font 6 Cash and cash equivalents i POSSIBLE DATA LOSS Some features might be lo 11379 8172 7 Short-term investments 618 696 8 Total cash 11997 8868 15 9 Receivables X fx 7432 7870 10 Inventories 1682 1619 B 11 Prepaid expenses D E 2378 2101 INTERNATIONAL BUSINESS MACHINES CORP (IBM) Staten 12 Other current assets Calibri 11 A A 25657 17962 Fiscal year ends in December. USD 2018-12 2019-12 13 Total current assets In Copy ~ 49146 38420 BIVA 14 Non current assets & Cash Flows From Operating Activities Format Painter 15 Property, plant and equipment Net income 8728 9431 Clipboard Font 16 Gross property, plant and equip Depreciation & amortization 4480 32461 6059 POSSIBLE DATA LOSS Some features might be lost if you save this workbooki 37023 17 Accumulated Depreciation Deferred income taxes 853 21668 -1527 -22018 fx 18 Net property, plant and equipm 10793 Stock based compensation 15005 510 679 19 Equity and other investments Change in working capital 554 A 1225 B 226 D E 222 20 Goodwill 36265 58222 Inventory -127 67 INTERNATIONAL BUSINESS MACHINES CORP (IBM) INCOM 21 Intangible assets 3088 15236 Accounts payable 126 -503 Fiscal year ends in December. USI 2018-12 2019-12 22 Deferred income taxes 5216 5182 1 Other working capital 555 1661 Revenue 79590 77147 23 Prepaid pension benefit 4929 7118 2. Other non-cash items 122 -1097 Cost of revenue 42655 40659 24 Other long term assets 13720 12781 3 Net cash provided by operating act 15247 14770 Gross profit 36935 36488 25 Total non-current assets 74237 113766 4 Cash Flows From Investing Activities Operating expenses 26 Total assets 123383 152186 5 Investments in property, plant, ani -3395 -2286 Research and development 5989 5379 27 Liabilities and stockholders' equity 6 Property, plant, and equipment rei 248 537 Sales, General and administrative 18863 19754 28 Liabilities 7 Acquisitions, net -139 -591 Other operating expenses -31554 114 29 Current liabilities 8 Purchases of investments -3693 -7041 Total operating expenses 23651 25857 30 Short-term debt 10207 8797 9 Sales/Maturities of investments 6487 3961 Operating income 13284 10631 31 Capital leases 1380 O Purchases of intangibles -569 -621 Interest Expense 723 1344 32 Accounts payable 6558 4896 -504 6720 Other income (expense) 1 Other investing activities -1219 879 33 Taxes payable 3046 2839 -4913 -26936 2 Net cash used for investing activiti Income before taxes 11342 10166 34 Accrued liabilities 3941 4357 3 Cash Flows From Financing Activities Provision for income taxes 2619 731 35 Deferred revenues 11165 12026 4 Debt issued 3406 3310 36 Other current liabilities 6891 31825 8723 9435 Net income from continuing oper -8533 -12944 5 Debt repayment 5 Net income from discontinuing op -4 38227 37 Total current liabilities 37701 Net income 6 Common stock issued 8728 38 Non current liabilities 9431 35605 39 Long-term debt 54102 7 Common stock repurchased -4614 -1633 Net income available to common 9431 8728 10 Capital leases 3879 8 Dividend paid -5666 -5707 Earnings per share 3696 11 Deferred taxes liabilities 5230 9 Other financing activities 1453 -2499 Basic 9.57 10.63 Accrued liabilities 320 299 O Net cash provided by (used for) fin -10469 9042 Diluted 9.52 10.56 13 Deferred revenues 3445 3851 1 Effect of exchange rate changes -495 -167 Weighted average shares outstanding 18382 14 Pensions and other benefits 18663 -630 2 Net change in cash -3291 Basic 912 887 15 Minority interest 134 144 3 Cash at beginning of period 12234 11604 Diluted 916 893 6 Other long-term liabilities 6777 7476 4 Cash at end of period 11604 8313 EBITDA 16545 17569 68359 7 Total non-current liabilities 93644 5 Free Cash Flow 8 Total liabilities 106586 131345 Operating cash flow 15247 14770 IBM Income Statement + 9 Stockholders' equity 7 Capital expenditure 3964 -2907 55151 55895 0 Common stock 3 Free cash flow 11283 11863 159206 162954 1 Retained earnings Type here to search O 9 -168071 2 Treasury stock 169413 -29490 -28595 IBM Cash Flow + 3 Accumulated other comprehens 20841 4 Total stockholders' equity eady 5 Total liabilities and stockholders 123382 152186 IBM Balance Sheet Type here to search 16796 Ready L X Cut ste SILIWNERAL BUSINESS MACHINES CORP (IBM) BALZ Paste LE Copy 2 Fiscal year ends in December. U 2018 12 2019-12 BIU & Format Painter 3 Assets 4 Current assets Clipboard 5 Cash Font 6 Cash and cash equivalents i POSSIBLE DATA LOSS Some features might be lo 11379 8172 7 Short-term investments 618 696 8 Total cash 11997 8868 15 9 Receivables X fx 7432 7870 10 Inventories 1682 1619 B 11 Prepaid expenses D E 2378 2101 INTERNATIONAL BUSINESS MACHINES CORP (IBM) Staten 12 Other current assets Calibri 11 A A 25657 17962 Fiscal year ends in December. USD 2018-12 2019-12 13 Total current assets In Copy ~ 49146 38420 BIVA 14 Non current assets & Cash Flows From Operating Activities Format Painter 15 Property, plant and equipment Net income 8728 9431 Clipboard Font 16 Gross property, plant and equip Depreciation & amortization 4480 32461 6059 POSSIBLE DATA LOSS Some features might be lost if you save this workbooki 37023 17 Accumulated Depreciation Deferred income taxes 853 21668 -1527 -22018 fx 18 Net property, plant and equipm 10793 Stock based compensation 15005 510 679 19 Equity and other investments Change in working capital 554 A 1225 B 226 D E 222 20 Goodwill 36265 58222 Inventory -127 67 INTERNATIONAL BUSINESS MACHINES CORP (IBM) INCOM 21 Intangible assets 3088 15236 Accounts payable 126 -503 Fiscal year ends in December. USI 2018-12 2019-12 22 Deferred income taxes 5216 5182 1 Other working capital 555 1661 Revenue 79590 77147 23 Prepaid pension benefit 4929 7118 2. Other non-cash items 122 -1097 Cost of revenue 42655 40659 24 Other long term assets 13720 12781 3 Net cash provided by operating act 15247 14770 Gross profit 36935 36488 25 Total non-current assets 74237 113766 4 Cash Flows From Investing Activities Operating expenses 26 Total assets 123383 152186 5 Investments in property, plant, ani -3395 -2286 Research and development 5989 5379 27 Liabilities and stockholders' equity 6 Property, plant, and equipment rei 248 537 Sales, General and administrative 18863 19754 28 Liabilities 7 Acquisitions, net -139 -591 Other operating expenses -31554 114 29 Current liabilities 8 Purchases of investments -3693 -7041 Total operating expenses 23651 25857 30 Short-term debt 10207 8797 9 Sales/Maturities of investments 6487 3961 Operating income 13284 10631 31 Capital leases 1380 O Purchases of intangibles -569 -621 Interest Expense 723 1344 32 Accounts payable 6558 4896 -504 6720 Other income (expense) 1 Other investing activities -1219 879 33 Taxes payable 3046 2839 -4913 -26936 2 Net cash used for investing activiti Income before taxes 11342 10166 34 Accrued liabilities 3941 4357 3 Cash Flows From Financing Activities Provision for income taxes 2619 731 35 Deferred revenues 11165 12026 4 Debt issued 3406 3310 36 Other current liabilities 6891 31825 8723 9435 Net income from continuing oper -8533 -12944 5 Debt repayment 5 Net income from discontinuing op -4 38227 37 Total current liabilities 37701 Net income 6 Common stock issued 8728 38 Non current liabilities 9431 35605 39 Long-term debt 54102 7 Common stock repurchased -4614 -1633 Net income available to common 9431 8728 10 Capital leases 3879 8 Dividend paid -5666 -5707 Earnings per share 3696 11 Deferred taxes liabilities 5230 9 Other financing activities 1453 -2499 Basic 9.57 10.63 Accrued liabilities 320 299 O Net cash provided by (used for) fin -10469 9042 Diluted 9.52 10.56 13 Deferred revenues 3445 3851 1 Effect of exchange rate changes -495 -167 Weighted average shares outstanding 18382 14 Pensions and other benefits 18663 -630 2 Net change in cash -3291 Basic 912 887 15 Minority interest 134 144 3 Cash at beginning of period 12234 11604 Diluted 916 893 6 Other long-term liabilities 6777 7476 4 Cash at end of period 11604 8313 EBITDA 16545 17569 68359 7 Total non-current liabilities 93644 5 Free Cash Flow 8 Total liabilities 106586 131345 Operating cash flow 15247 14770 IBM Income Statement + 9 Stockholders' equity 7 Capital expenditure 3964 -2907 55151 55895 0 Common stock 3 Free cash flow 11283 11863 159206 162954 1 Retained earnings Type here to search O 9 -168071 2 Treasury stock 169413 -29490 -28595 IBM Cash Flow + 3 Accumulated other comprehens 20841 4 Total stockholders' equity eady 5 Total liabilities and stockholders 123382 152186 IBM Balance Sheet Type here to search 16796 Ready