

Answered step by step
Verified Expert Solution
Question
1 Approved Answer
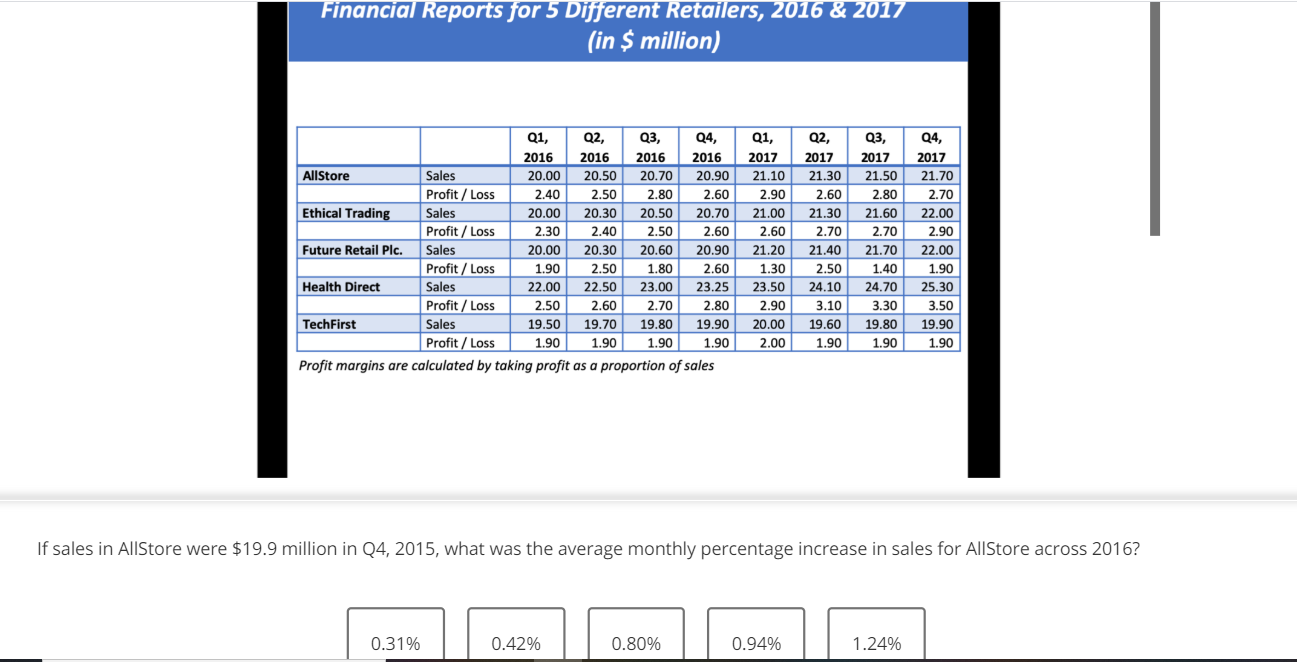
Financial Reports for 5 Different Retailers, 2016 & 2017 (in $ million) Q1, Q2, Q3, Q4, 2016 2016 2016 2016 AllStore Sales 20.00 20.50 20.70
Step by Step Solution
There are 3 Steps involved in it
Step: 1

Get Instant Access to Expert-Tailored Solutions
See step-by-step solutions with expert insights and AI powered tools for academic success
Step: 2

Step: 3
Ace Your Homework with AI
Get the answers you need in no time with our AI-driven, step-by-step assistance
Get Started
Eco Management The Elmwood Guide To Ecological Auditing And Sustainable Business
Authors: Ernest Callenbach, Fritjof Capra, Lenore Goldman, Rudiger Lutz
1st Edition
1881052273, 978-1881052272