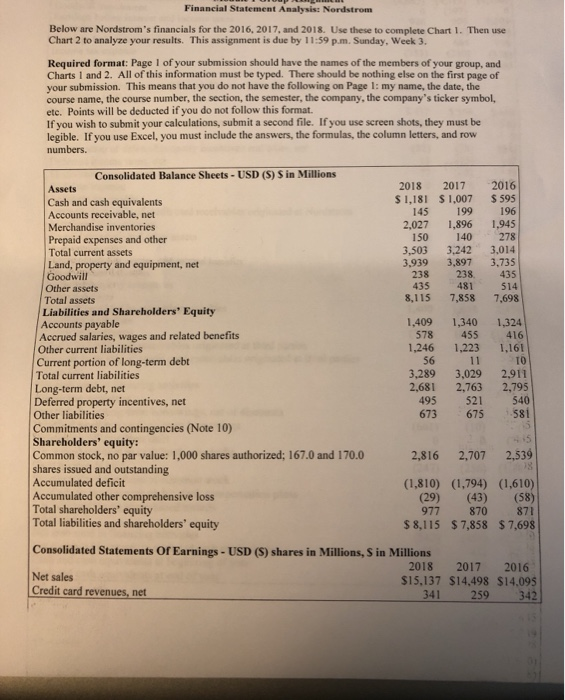
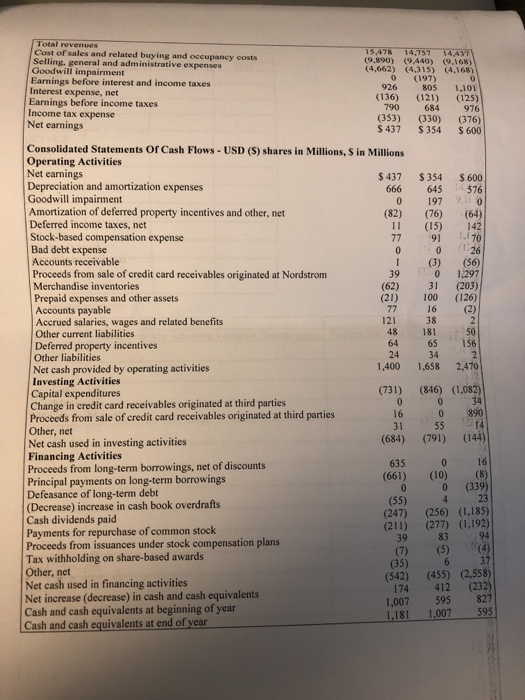
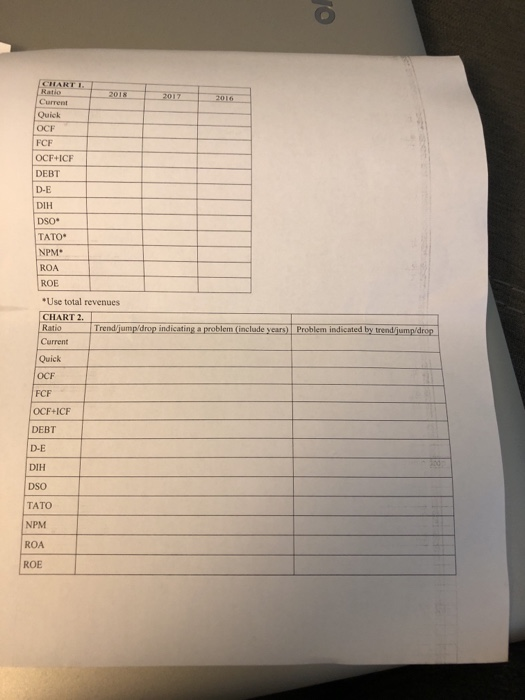
Financial Statement Analysis Nordstrom Below are Nordstrom's financials for the 2016, 2017, and 2018. Use these to complete Chart 1. Then use Chart 2 to analyze your results. This assignment is due by 11:59p.m. Sunday, Week 3. Required format: Page 1 of your submission should have the names of the members of your group, and Charts 1 and 2. All of this information must be typed. There should be nothing else on the first page of your submission. This means that you do not have the following on Page 1: my name, the date, the course name, the course number, the section, the semester, the company, the company's ticker symbol. etc. Points will be deducted if you do not follow this format. If you wish to submit your calculations, submit a second file. If you use screen shots, they must be legible. If you use Excel, you must include the answers, the formulas, the column letters, and row numbers. 2016 $ 595 196 2018 2017 $ 1,181 $ 1.007 145199 2,027 1,896 150 140 3,503 3.242 3,939 3,897 238 238 435 481 8,115 7,858 1.945 278 3.014 3,735 435 514 7,698 Consolidated Balance Sheets - USD (S) Sin Millions Assets Cash and cash equivalents Accounts receivable, net Merchandise inventories Prepaid expenses and other Total current assets Land, property and equipment, net Goodwill Other assets Total assets Liabilities and Shareholders' Equity Accounts payable Accrued salaries, wages and related benefits Other current liabilities Current portion of long-term debt Total current liabilities Long-term debt, net Deferred property incentives, net Other liabilities Commitments and contingencies (Note 10) Shareholders' equity: Common stock, no par value: 1,000 shares authorized; 167.0 and 170.0 shares issued and outstanding Accumulated deficit Accumulated other comprehensive loss Total shareholders' equity Total liabilities and shareholders' equity 1,409 578 1,246 56 3,289 2,681 495 673 1,340 455 1,223 11 3,029 2,763 521 675 1,324 416 1,161 TO 2,911 2,795 540 581 2,816 2,707 2,539 (1,810) (1,794) (1,610) (29) (43) (58) 977 870 $ 8,115 $7,858 $ 7,698 871 Consolidated Statements or Earnings - USD (S) shares in Millions, S in Millions 2018 2017 2016 Net sales $15,137 $14,498 $14.095 Credit card revenues, net 341 259 342 352=*-AQSF3*3*3 (2) Total revenues Cost of sales and related buying and occupancy costs 15,478 14,757 14.427 Selling. general and administrative expenses (9,890) (9.440) (9.168) Goodwill impairment (4.662) (4.315) (4.168) Earnings before interest and income taxes (197) Interest expense, net 926 805 1.101 (136) (121) Earnings before income taxes (125) 790 684 Income tax expense 976 (353) (330) Net earnings (376) $ 437 S354 S 600 Consolidated Statements or Cash Flows - USD (S) shares in Millions, S in Millions Operating Activities Net earnings $ 437 $ 354 $ 600 Depreciation and amortization expenses 666 645 576 Goodwill impairment 0 197 9.00 Amortization of deferred property incentives and other, net (82) (76) (64) Deferred income taxes, net 11 (15) 142 Stock-based compensation expense 77 9170 Bad debt expense 0 0 .26 Accounts receivable (3) (56) Proceeds from sale of credit card receivables originated at Nordstrom 01.297 Merchandise inventories 31 (203) Prepaid expenses and other assets 100 (126) Accounts payable 16 Accrued salaries, wages and related benefits Other current liabilities Deferred property incentives 156 Other liabilities Net cash provided by operating activities 1,400 1,658 2,470 Investing Activities Capital expenditures (731) (846) (1.082) Change in credit card receivables originated at third parties 16 Proceeds from sale of credit card receivables originated at third parties 0 890 31 55 212 Other, net Net cash used in investing activities (684) (791) (144) Financing Activities 635 016 Proceeds from long-term borrowings, net of discounts (661) (10) (8) Principal payments on long-term borrowings 0 (339) Defeasance of long-term debt (Decrease) increase in cash book overdrafts (1.185) Cash dividends paid (211) (277) (1.192) Payments for repurchase of common stock Proceeds from issuances under stock compensation plans (4) Tax withholding on share-based awards (35) Other, net (542) (455) (2.558) Net cash used in financing activities 412 (232) Net increase (decrease) in cash and cash equivalents 595 827 Cash and cash equivalents at beginning of year 1,181 1,007 595 Cash and cash equivalents at end of year 38 181 (247) 94 174 1,007 Oui OCF FCF OCF-ICH DEBT D-E DIH DSO TATO NPM ROA ROE *Use total revenues CHART 2. Ratio Trend/jump drop indicating a problem (include years) Problem indicated by trend/jump/drop Current Quick OCF OCFICF DEBT D-E DIH DSO TATO NPM ROA Financial Statement Analysis Nordstrom Below are Nordstrom's financials for the 2016, 2017, and 2018. Use these to complete Chart 1. Then use Chart 2 to analyze your results. This assignment is due by 11:59p.m. Sunday, Week 3. Required format: Page 1 of your submission should have the names of the members of your group, and Charts 1 and 2. All of this information must be typed. There should be nothing else on the first page of your submission. This means that you do not have the following on Page 1: my name, the date, the course name, the course number, the section, the semester, the company, the company's ticker symbol. etc. Points will be deducted if you do not follow this format. If you wish to submit your calculations, submit a second file. If you use screen shots, they must be legible. If you use Excel, you must include the answers, the formulas, the column letters, and row numbers. 2016 $ 595 196 2018 2017 $ 1,181 $ 1.007 145199 2,027 1,896 150 140 3,503 3.242 3,939 3,897 238 238 435 481 8,115 7,858 1.945 278 3.014 3,735 435 514 7,698 Consolidated Balance Sheets - USD (S) Sin Millions Assets Cash and cash equivalents Accounts receivable, net Merchandise inventories Prepaid expenses and other Total current assets Land, property and equipment, net Goodwill Other assets Total assets Liabilities and Shareholders' Equity Accounts payable Accrued salaries, wages and related benefits Other current liabilities Current portion of long-term debt Total current liabilities Long-term debt, net Deferred property incentives, net Other liabilities Commitments and contingencies (Note 10) Shareholders' equity: Common stock, no par value: 1,000 shares authorized; 167.0 and 170.0 shares issued and outstanding Accumulated deficit Accumulated other comprehensive loss Total shareholders' equity Total liabilities and shareholders' equity 1,409 578 1,246 56 3,289 2,681 495 673 1,340 455 1,223 11 3,029 2,763 521 675 1,324 416 1,161 TO 2,911 2,795 540 581 2,816 2,707 2,539 (1,810) (1,794) (1,610) (29) (43) (58) 977 870 $ 8,115 $7,858 $ 7,698 871 Consolidated Statements or Earnings - USD (S) shares in Millions, S in Millions 2018 2017 2016 Net sales $15,137 $14,498 $14.095 Credit card revenues, net 341 259 342 352=*-AQSF3*3*3 (2) Total revenues Cost of sales and related buying and occupancy costs 15,478 14,757 14.427 Selling. general and administrative expenses (9,890) (9.440) (9.168) Goodwill impairment (4.662) (4.315) (4.168) Earnings before interest and income taxes (197) Interest expense, net 926 805 1.101 (136) (121) Earnings before income taxes (125) 790 684 Income tax expense 976 (353) (330) Net earnings (376) $ 437 S354 S 600 Consolidated Statements or Cash Flows - USD (S) shares in Millions, S in Millions Operating Activities Net earnings $ 437 $ 354 $ 600 Depreciation and amortization expenses 666 645 576 Goodwill impairment 0 197 9.00 Amortization of deferred property incentives and other, net (82) (76) (64) Deferred income taxes, net 11 (15) 142 Stock-based compensation expense 77 9170 Bad debt expense 0 0 .26 Accounts receivable (3) (56) Proceeds from sale of credit card receivables originated at Nordstrom 01.297 Merchandise inventories 31 (203) Prepaid expenses and other assets 100 (126) Accounts payable 16 Accrued salaries, wages and related benefits Other current liabilities Deferred property incentives 156 Other liabilities Net cash provided by operating activities 1,400 1,658 2,470 Investing Activities Capital expenditures (731) (846) (1.082) Change in credit card receivables originated at third parties 16 Proceeds from sale of credit card receivables originated at third parties 0 890 31 55 212 Other, net Net cash used in investing activities (684) (791) (144) Financing Activities 635 016 Proceeds from long-term borrowings, net of discounts (661) (10) (8) Principal payments on long-term borrowings 0 (339) Defeasance of long-term debt (Decrease) increase in cash book overdrafts (1.185) Cash dividends paid (211) (277) (1.192) Payments for repurchase of common stock Proceeds from issuances under stock compensation plans (4) Tax withholding on share-based awards (35) Other, net (542) (455) (2.558) Net cash used in financing activities 412 (232) Net increase (decrease) in cash and cash equivalents 595 827 Cash and cash equivalents at beginning of year 1,181 1,007 595 Cash and cash equivalents at end of year 38 181 (247) 94 174 1,007 Oui OCF FCF OCF-ICH DEBT D-E DIH DSO TATO NPM ROA ROE *Use total revenues CHART 2. Ratio Trend/jump drop indicating a problem (include years) Problem indicated by trend/jump/drop Current Quick OCF OCFICF DEBT D-E DIH DSO TATO NPM ROA