Financial statement analysis, or simply financial analysis, refers to an examination of the viability, stability and profitability of a business enterprise as a whole, or a particular project that it has undertaken. It is performed by expert professionals who prepare reports using the information taken from the companys financial records. These reports are usually presented to the top management and are used as a primary tool in making business decisions. Because of these factors, financial statement analysis has immense value in academics and the business world.
This assignment is designed to assess your ability to evaluate the performance of Accounting Solutions, LLC through a critical analysis of its available financial statements over a specific period. Please structure your opinion(s) and justify your arguments about Accounting Solutions, LLCs financial performance.
Structure an opinion/argument/evaluation about performance based on your analysis of the following three factors:
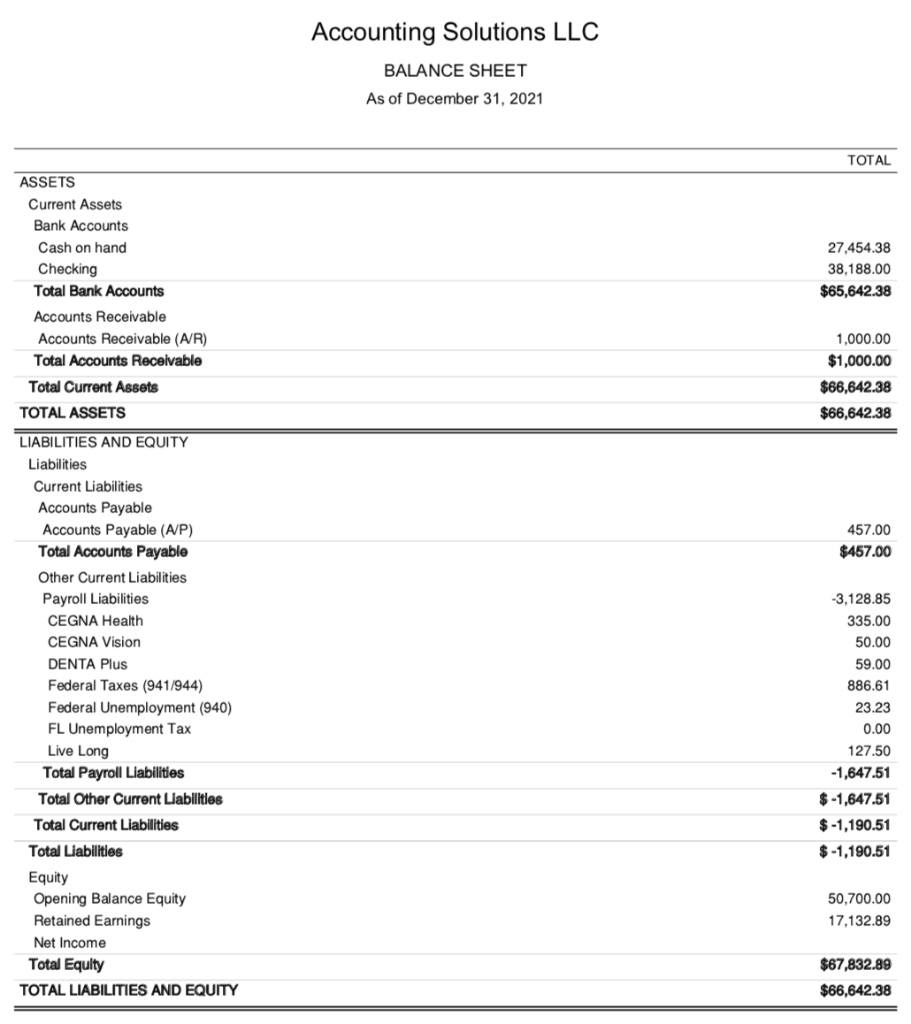
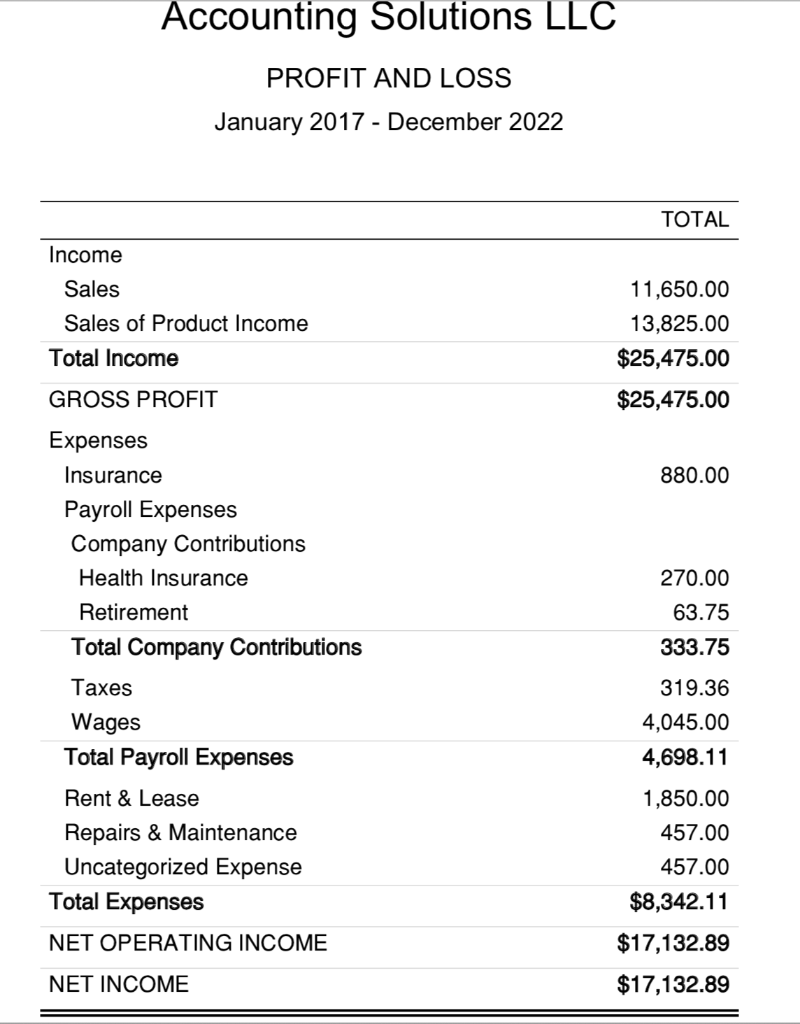
- Profitability (gross margin ratio, profit margin ratio, return on capital)
- Balance Sheet ratios (working capital, current ratio, and debt to equity ratio)
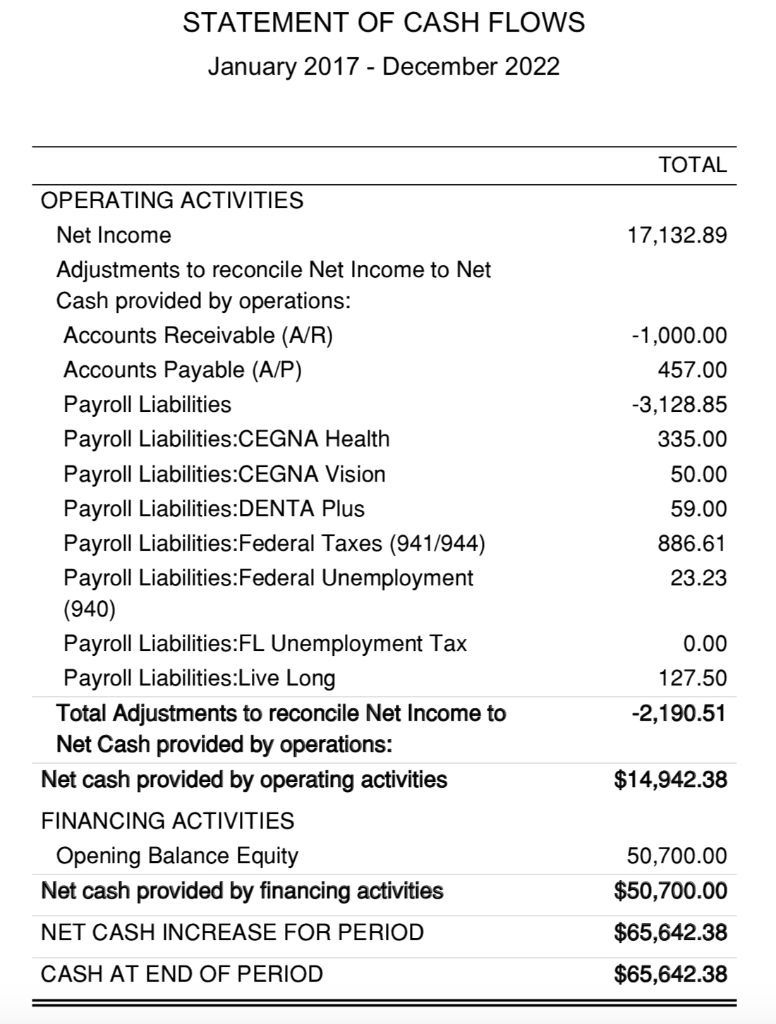
- Free Cash Flow.
Present a clear, well-structured report using appropriate style and language. (Do your best to write it as though you were an accounting professional.) This paper should be approximately 3-4 pages (excluding tables). Double-space. Please use Arial font 12 and submit via D2L under "Final Paper: Financial Statement Analysis".


Accounting Solutions LLC BALANCE SHEET As of December 31, 2021 TOTAL 27,454.38 38,188.00 $65,642.38 1,000.00 $1,000.00 $66,642.38 $66,642.38 ASSETS Current Assets Bank Accounts Cash on hand Checking Total Bank Accounts Accounts Receivable Accounts Receivable (A/R) Total Accounts Receivable Total Current Assets TOTAL ASSETS LIABILITIES AND EQUITY Liabilities Current Liabilities Accounts Payable Accounts Payable (A/P) Total Accounts Payable Other Current Liabilities Payroll Liabilities CEGNA Health CEGNA Vision DENTA Plus Federal Taxes (941/944) Federal Unemployment (940) FL Unemployment Tax 457.00 $457.00 -3,128.85 335.00 50.00 59.00 886.61 23.23 0.00 127.50 -1,647.51 $-1,647.51 $-1,190.51 $ -1,190.51 Live Long Total Payroll Liabilities Total Other Current Liabilities Total Current Liabilities Total Liabilities Equity Opening Balance Equity Retained Earnings Net Income Total Equity TOTAL LIABILITIES AND EQUITY 50,700.00 17,132.89 $67,832.89 $66,642.38 STATEMENT OF CASH FLOWS January 2017 - December 2022 TOTAL 17,132.89 OPERATING ACTIVITIES Net Income Adjustments to reconcile Net Income to Net Cash provided by operations: Accounts Receivable (A/R) Accounts Payable (A/P) Payroll Liabilities Payroll Liabilities:CEGNA Health Payroll Liabilities:CEGNA Vision Payroll Liabilities:DENTA Plus Payroll Liabilities:Federal Taxes (941/944) Payroll Liabilities:Federal Unemployment (940) Payroll Liabilities:FL Unemployment Tax Payroll Liabilities:Live Long Total Adjustments to reconcile Net Income to Net Cash provided by operations: Net cash provided by operating activities FINANCING ACTIVITIES Opening Balance Equity Net cash provided by financing activities NET CASH INCREASE FOR PERIOD CASH AT END OF PERIOD -1,000.00 457.00 -3,128.85 335.00 50.00 59.00 886.61 23.23 0.00 127.50 -2,190.51 $14,942.38 50,700.00 $50,700.00 $65,642.38 $65,642.38 Accounting Solutions LLC PROFIT AND LOSS January 2017 - December 2022 TOTAL Income Sales Sales of Product Income Total Income 11,650.00 13,825.00 $25,475.00 $25,475.00 GROSS PROFIT 880.00 Expenses Insurance Payroll Expenses Company Contributions Health Insurance Retirement Total Company Contributions 270.00 63.75 333.75 Taxes Wages Total Payroll Expenses Rent & Lease Repairs & Maintenance Uncategorized Expense Total Expenses NET OPERATING INCOME 319.36 4,045.00 4,698.11 1,850.00 457.00 457.00 $8,342.11 $17,132.89 NET INCOME $17,132.89 Accounting Solutions LLC BALANCE SHEET As of December 31, 2021 TOTAL 27,454.38 38,188.00 $65,642.38 1,000.00 $1,000.00 $66,642.38 $66,642.38 ASSETS Current Assets Bank Accounts Cash on hand Checking Total Bank Accounts Accounts Receivable Accounts Receivable (A/R) Total Accounts Receivable Total Current Assets TOTAL ASSETS LIABILITIES AND EQUITY Liabilities Current Liabilities Accounts Payable Accounts Payable (A/P) Total Accounts Payable Other Current Liabilities Payroll Liabilities CEGNA Health CEGNA Vision DENTA Plus Federal Taxes (941/944) Federal Unemployment (940) FL Unemployment Tax 457.00 $457.00 -3,128.85 335.00 50.00 59.00 886.61 23.23 0.00 127.50 -1,647.51 $-1,647.51 $-1,190.51 $ -1,190.51 Live Long Total Payroll Liabilities Total Other Current Liabilities Total Current Liabilities Total Liabilities Equity Opening Balance Equity Retained Earnings Net Income Total Equity TOTAL LIABILITIES AND EQUITY 50,700.00 17,132.89 $67,832.89 $66,642.38 STATEMENT OF CASH FLOWS January 2017 - December 2022 TOTAL 17,132.89 OPERATING ACTIVITIES Net Income Adjustments to reconcile Net Income to Net Cash provided by operations: Accounts Receivable (A/R) Accounts Payable (A/P) Payroll Liabilities Payroll Liabilities:CEGNA Health Payroll Liabilities:CEGNA Vision Payroll Liabilities:DENTA Plus Payroll Liabilities:Federal Taxes (941/944) Payroll Liabilities:Federal Unemployment (940) Payroll Liabilities:FL Unemployment Tax Payroll Liabilities:Live Long Total Adjustments to reconcile Net Income to Net Cash provided by operations: Net cash provided by operating activities FINANCING ACTIVITIES Opening Balance Equity Net cash provided by financing activities NET CASH INCREASE FOR PERIOD CASH AT END OF PERIOD -1,000.00 457.00 -3,128.85 335.00 50.00 59.00 886.61 23.23 0.00 127.50 -2,190.51 $14,942.38 50,700.00 $50,700.00 $65,642.38 $65,642.38 Accounting Solutions LLC PROFIT AND LOSS January 2017 - December 2022 TOTAL Income Sales Sales of Product Income Total Income 11,650.00 13,825.00 $25,475.00 $25,475.00 GROSS PROFIT 880.00 Expenses Insurance Payroll Expenses Company Contributions Health Insurance Retirement Total Company Contributions 270.00 63.75 333.75 Taxes Wages Total Payroll Expenses Rent & Lease Repairs & Maintenance Uncategorized Expense Total Expenses NET OPERATING INCOME 319.36 4,045.00 4,698.11 1,850.00 457.00 457.00 $8,342.11 $17,132.89 NET INCOME $17,132.89


