financial statement and ration analysis
explain it?

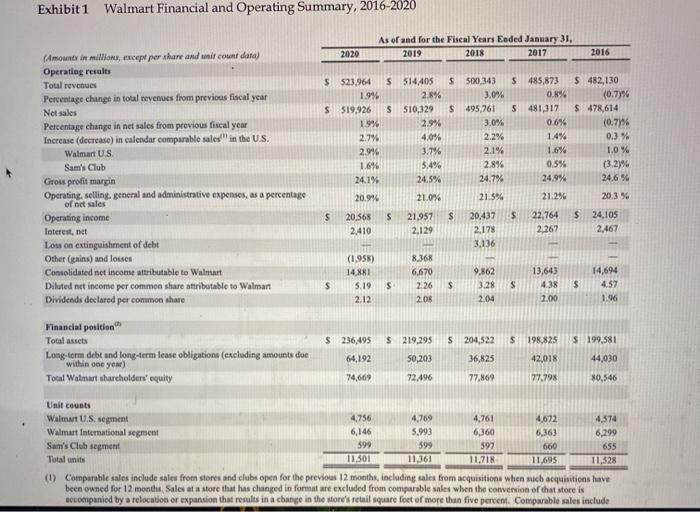
Exhibit 1 Walmart Financial and Operating Summary, 2016-2020 As of and for the Fiscal Years Eoded January 31, 2019 2018 2017 2020 2016 S $23.964 1.946 $ $19.926 1.996 2.7% 2.946 1.6% 24.1% 20.99 5 514405 2.8% S510,329 2.9% 4,0% 3.7% 5.4% 24.5% $ 500,343 3.0% $ 495,761 3.0% 2.2% 2.1% 2.8% 24.7% 21.596 $ 485,873 0.894 S481,317 0.6% 1.4% 1.6% 0.5% 24.9% 21.296 $ 482,130 (0.73% $ 478,614 (0.77% 0.3% 1.0% (3.276 24,6% 20.3 % 21.0% $ s $ (Amount in million, except per share and somit count data) Operating results Total revenues Percentage change in total revenues from previous fiscal year Net sales Percentage change in net sales from previous fiscal year Increase (decrease) in calendar comparable sales in the US. Walmart U.S. Sam's Club Gross profit margin Operating selling general and administrative expenses, as a percentage of net sales Operating income Interest, net Los on extinguishment of debt Other (gains) and losses Consolidated net income attributable to Walmart Diluted set income per common share attributable to Walmart Dividends declared per common share Financial position Total assets Long-term debt and long-term lease obligations (excluding amounts due within one year) Total Wulmart shareholders' equity $ $ 20.568 2.410 21,957 2.129 20,437 2,178 3,136 22,764 2.267 24,105 2,467 (1.958) 14 5.19 2.12 8.368 6,670 2.26 2.08 S 14,694 4.57 $ 9.862 3.28 2.04 $ 13.643 4.38 2.00 s $ 1.96 $ 236,495 S 198,825 $ 199,581 $ 219,295 50,203 $ 204,522 36,825 64,192 42,018 44,030 74,669 72.496 77,869 77.798 $0,546 Unit counts Walmart U.S. segment 4,756 4,769 4,761 4,672 4.574 Walmart International segment 6,146 5,993 6,360 6,363 6,299 Sam's Club segment 399 599 592 660 655 Total units 11.301 11361 11,718 11.695 11,528 (1) Comparable sales include sales from stores and clubs open for the previous 12 months, including sales from acquisitions when such acquisitions have been owned for 12 months Sales at a store that has changed in format are excluded from comparable sales when the conversion of that store is Becompanied by a relocation or expansion that results in a change in the store's retail square feet of more than five percent. Comparable sales include Financial Ratlo Data for Year 3 +/- Ratio Year 1 Year 2 Liquidity Leverage Activity Profitability Growth Valuation Exhibit 1 Walmart Financial and Operating Summary, 2016-2020 As of and for the Fiscal Years Eoded January 31, 2019 2018 2017 2020 2016 S $23.964 1.946 $ $19.926 1.996 2.7% 2.946 1.6% 24.1% 20.99 5 514405 2.8% S510,329 2.9% 4,0% 3.7% 5.4% 24.5% $ 500,343 3.0% $ 495,761 3.0% 2.2% 2.1% 2.8% 24.7% 21.596 $ 485,873 0.894 S481,317 0.6% 1.4% 1.6% 0.5% 24.9% 21.296 $ 482,130 (0.73% $ 478,614 (0.77% 0.3% 1.0% (3.276 24,6% 20.3 % 21.0% $ s $ (Amount in million, except per share and somit count data) Operating results Total revenues Percentage change in total revenues from previous fiscal year Net sales Percentage change in net sales from previous fiscal year Increase (decrease) in calendar comparable sales in the US. Walmart U.S. Sam's Club Gross profit margin Operating selling general and administrative expenses, as a percentage of net sales Operating income Interest, net Los on extinguishment of debt Other (gains) and losses Consolidated net income attributable to Walmart Diluted set income per common share attributable to Walmart Dividends declared per common share Financial position Total assets Long-term debt and long-term lease obligations (excluding amounts due within one year) Total Wulmart shareholders' equity $ $ 20.568 2.410 21,957 2.129 20,437 2,178 3,136 22,764 2.267 24,105 2,467 (1.958) 14 5.19 2.12 8.368 6,670 2.26 2.08 S 14,694 4.57 $ 9.862 3.28 2.04 $ 13.643 4.38 2.00 s $ 1.96 $ 236,495 S 198,825 $ 199,581 $ 219,295 50,203 $ 204,522 36,825 64,192 42,018 44,030 74,669 72.496 77,869 77.798 $0,546 Unit counts Walmart U.S. segment 4,756 4,769 4,761 4,672 4.574 Walmart International segment 6,146 5,993 6,360 6,363 6,299 Sam's Club segment 399 599 592 660 655 Total units 11.301 11361 11,718 11.695 11,528 (1) Comparable sales include sales from stores and clubs open for the previous 12 months, including sales from acquisitions when such acquisitions have been owned for 12 months Sales at a store that has changed in format are excluded from comparable sales when the conversion of that store is Becompanied by a relocation or expansion that results in a change in the store's retail square feet of more than five percent. Comparable sales include Financial Ratlo Data for Year 3 +/- Ratio Year 1 Year 2 Liquidity Leverage Activity Profitability Growth Valuation


