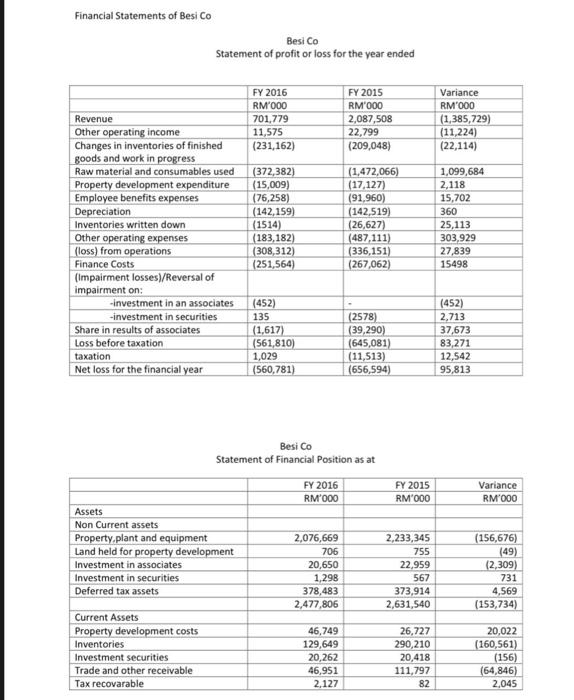
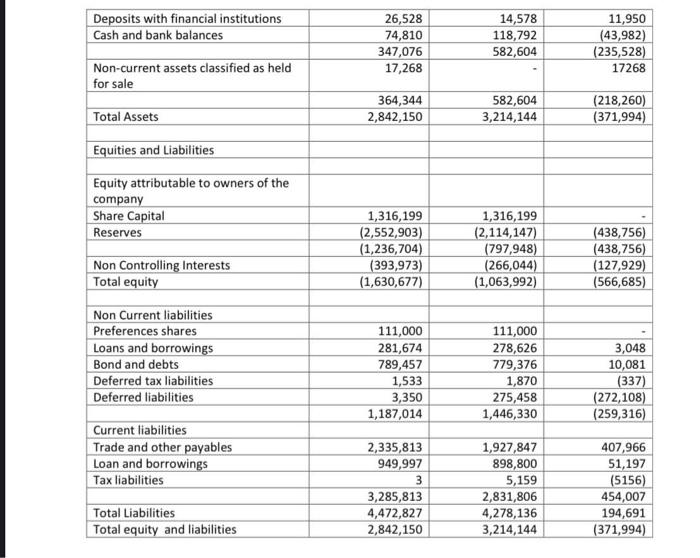
Financial Statements of Besi Co Besi Co Statement of profit or loss for the year ended FY 2016 RM000 701,779 11,575 (231,162) FY 2015 RM'000 2,087,508 22,799 (209,048) Variance RM'000 (1,385,729) (11,224) (22,114) Revenue Other operating income Changes in inventories of finished goods and work in progress Raw material and consumables used Property development expenditure Employee benefits expenses Depreciation Inventories written down Other operating expenses (loss) from operations Finance Costs (Impairment losses)/Reversal of impairment on: -Investment in an associates -investment in securities Share in results of associates Loss before taxation taxation Net loss for the financial year (372,382) (15,009) (76,258) (142,159) (1514) (183,182) (308,312) (251,564) (1,472,066) (17,127) (91,960) (142,519) (26,627) (487,111) (336,151) (267,062) 1,099,684 2,118 15,702 360 25,113 303,929 27,839 15498 (452) 135 (1,617) (561,810) 1,029 (560,781) (2578) (39,290) (645,081) (11,513) (656,594) (452) 2,713 37,673 83,271 12,542 95,813 Besi Co Statement of Financial Position as at FY 2016 RM'000 FY 2015 RM'000 Variance RM 000 Assets Non Current assets Property.plant and equipment Land held for property development Investment in associates Investment in securities Deferred tax assets 2,076,669 706 20,650 1,298 378,483 2,477,806 2,233,345 755 22,959 567 373,914 2,631,540 (156,676) (49) (2,309) 731 4,569 (153,734) Current Assets Property development costs Inventories Investment securities Trade and other receivable Tax recovarable 46,749 129,649 20,262 46,951 2,127 26,727 290, 210 20,418 111,797 82 20,022 (160,561) (156) (64,846) 2.045 Deposits with financial institutions Cash and bank balances 26,528 74,810 347,076 17,268 14,578 118,792 582,604 11,950 (43,982) (235,528) 17268 Non-current assets classified as held for sale Total Assets 364,344 2,842,150 582,604 3,214,144 (218,260) (371,994) Equities and Liabilities Equity attributable to owners of the company Share Capital Reserves 1,316,199 (2,552,903) (1,236,704) (393,973) (1,630,677) 1,316,199 (2,114,147) (797,948) (266,044) (1,063,992) Non Controlling Interests Total equity (438,756) (438,756) (127,929) (566,685) Non Current liabilities Preferences shares Loans and borrowings Bond and debts Deferred tax liabilities Deferred liabilities Current liabilities Trade and other payables Loan and borrowings Tax liabilities 111,000 281,674 789,457 1,533 3,350 1,187,014 111,000 278,626 779,376 1,870 275,458 1,446,330 3,048 10,081 (337) (272,108) (259,316) 2,335,813 949,997 3 3,285,813 4,472,827 2,842,150 1,927,847 898,800 5,159 2,831,806 4,278,136 3,214,144 407,966 51,197 (5156) 454,007 194,691 (371,994) Total Liabilities Total equity and liabilities 2. Based on Appendix 2, prepare a financial statement analysis for the managing director of BesiCo indicating the following: Financial performance (10 Marks) Financial position (10 Marks) Financial ratio analysis (35 Marks) a. b. C. Financial Statements of Besi Co Besi Co Statement of profit or loss for the year ended FY 2016 RM000 701,779 11,575 (231,162) FY 2015 RM'000 2,087,508 22,799 (209,048) Variance RM'000 (1,385,729) (11,224) (22,114) Revenue Other operating income Changes in inventories of finished goods and work in progress Raw material and consumables used Property development expenditure Employee benefits expenses Depreciation Inventories written down Other operating expenses (loss) from operations Finance Costs (Impairment losses)/Reversal of impairment on: -Investment in an associates -investment in securities Share in results of associates Loss before taxation taxation Net loss for the financial year (372,382) (15,009) (76,258) (142,159) (1514) (183,182) (308,312) (251,564) (1,472,066) (17,127) (91,960) (142,519) (26,627) (487,111) (336,151) (267,062) 1,099,684 2,118 15,702 360 25,113 303,929 27,839 15498 (452) 135 (1,617) (561,810) 1,029 (560,781) (2578) (39,290) (645,081) (11,513) (656,594) (452) 2,713 37,673 83,271 12,542 95,813 Besi Co Statement of Financial Position as at FY 2016 RM'000 FY 2015 RM'000 Variance RM 000 Assets Non Current assets Property.plant and equipment Land held for property development Investment in associates Investment in securities Deferred tax assets 2,076,669 706 20,650 1,298 378,483 2,477,806 2,233,345 755 22,959 567 373,914 2,631,540 (156,676) (49) (2,309) 731 4,569 (153,734) Current Assets Property development costs Inventories Investment securities Trade and other receivable Tax recovarable 46,749 129,649 20,262 46,951 2,127 26,727 290, 210 20,418 111,797 82 20,022 (160,561) (156) (64,846) 2.045 Deposits with financial institutions Cash and bank balances 26,528 74,810 347,076 17,268 14,578 118,792 582,604 11,950 (43,982) (235,528) 17268 Non-current assets classified as held for sale Total Assets 364,344 2,842,150 582,604 3,214,144 (218,260) (371,994) Equities and Liabilities Equity attributable to owners of the company Share Capital Reserves 1,316,199 (2,552,903) (1,236,704) (393,973) (1,630,677) 1,316,199 (2,114,147) (797,948) (266,044) (1,063,992) Non Controlling Interests Total equity (438,756) (438,756) (127,929) (566,685) Non Current liabilities Preferences shares Loans and borrowings Bond and debts Deferred tax liabilities Deferred liabilities Current liabilities Trade and other payables Loan and borrowings Tax liabilities 111,000 281,674 789,457 1,533 3,350 1,187,014 111,000 278,626 779,376 1,870 275,458 1,446,330 3,048 10,081 (337) (272,108) (259,316) 2,335,813 949,997 3 3,285,813 4,472,827 2,842,150 1,927,847 898,800 5,159 2,831,806 4,278,136 3,214,144 407,966 51,197 (5156) 454,007 194,691 (371,994) Total Liabilities Total equity and liabilities 2. Based on Appendix 2, prepare a financial statement analysis for the managing director of BesiCo indicating the following: Financial performance (10 Marks) Financial position (10 Marks) Financial ratio analysis (35 Marks) a. b. C