

Question
Financial statements of SPI Inc. are provided below: Additional information: December 31, Year 1, total assets and total shareholders' equity were $325,000 and $287,500, respectively.
Financial statements of SPI Inc. are provided below: Additional information: December 31, Year 1, total assets and total shareholders' equity were $325,000 and $287,500, respectively.
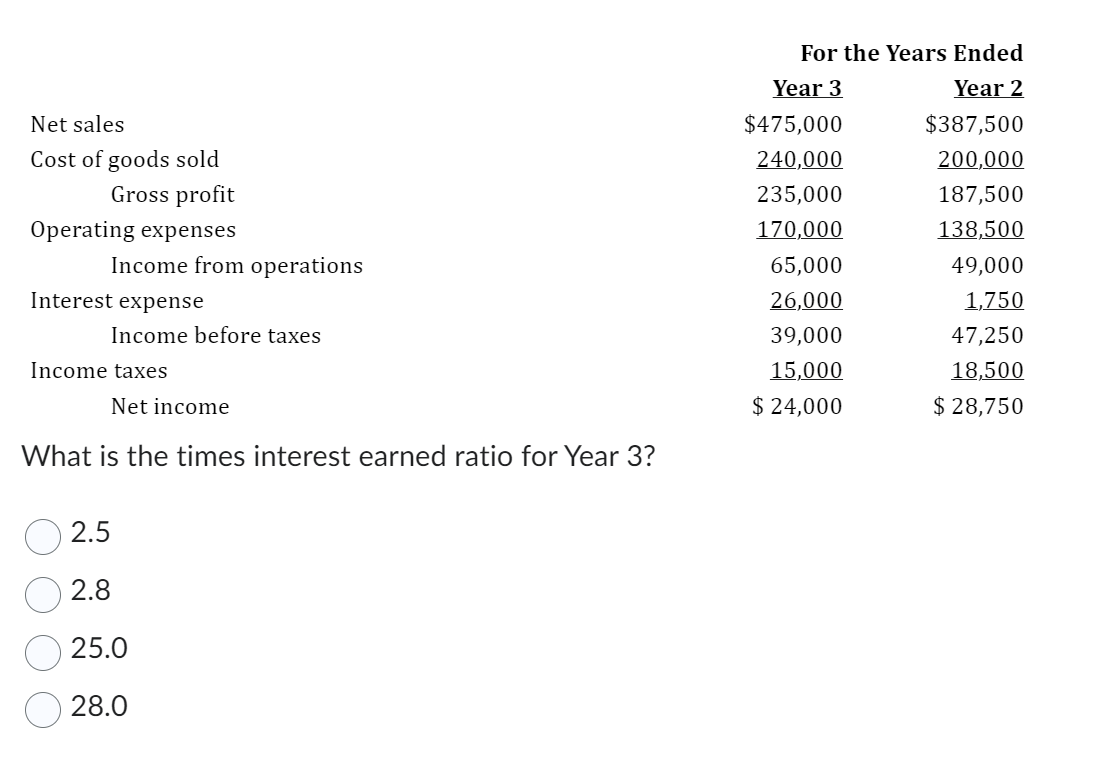
December 31Assets:Year 3Year 2Current assets:Cash$ 61,100$54,000Accounts receivable22,50017,500Inventory8,5007,000Other current assets6,5005,500Total current assets98,60084,000Long-term assets:Property, plant & equipment, net744,90025,000Intangible assets211,250225,000Total assets$1,054,750$334,000Liabilities and Shareholders' EquityCurrent liabilities:Accounts payable$ 5,500$ 4,500Interest payable500500Current portion of long-term debt15,0000Income tax payable18,50023,000Total current liabilities $ 39,50028,000Long-term liabilities:Notes payable246,25015,000Total liabilities285,75043,000Shareholders' equityCommon shares60,00035,000Additional paid-in capital654,000186,000Retained earnings92,50070,000Repurchased shares(37,500)0Total shareholders' equity769,000291,000Total liabilities and shareholders' equity$1,054,750$334,000For the Years EndedYear 3Year 2Net sales$475,000$387,500Cost of goods sold240,000200,000Gross profit235,000187,500Operating expenses170,000138,500Income from operations65,00049,000Interest expense26,0001,750Income before taxes39,00047,250Income taxes15,00018,500Net income$ 24,000$ 28,750
What is the times interest earned ratio for Year 3?
2.5 2.8 25.0 28.0
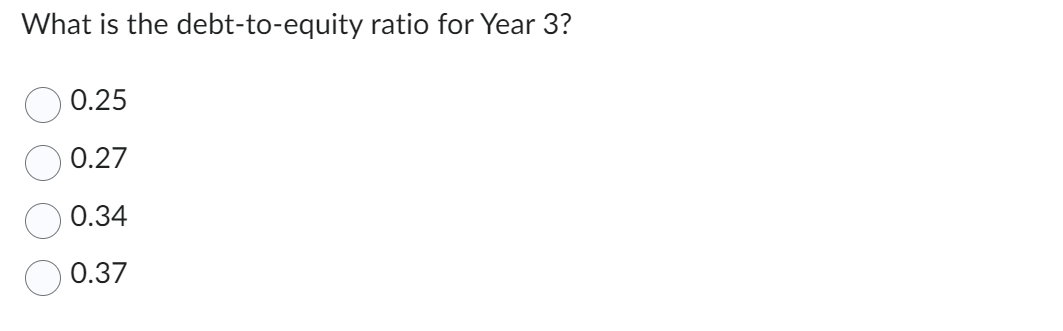
What is the debt-to-equity ratio for Year 3?
0.25 0.27 0.34 0.37
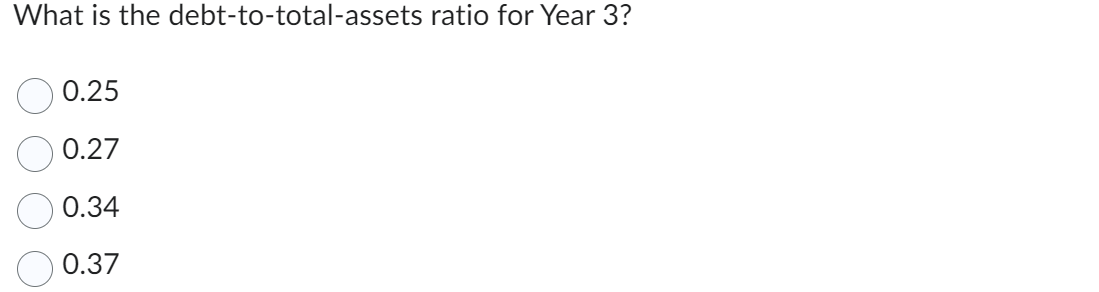
What is the debt-to-total-assets ratio for Year 3?
0.25 0.27 0.34 0.37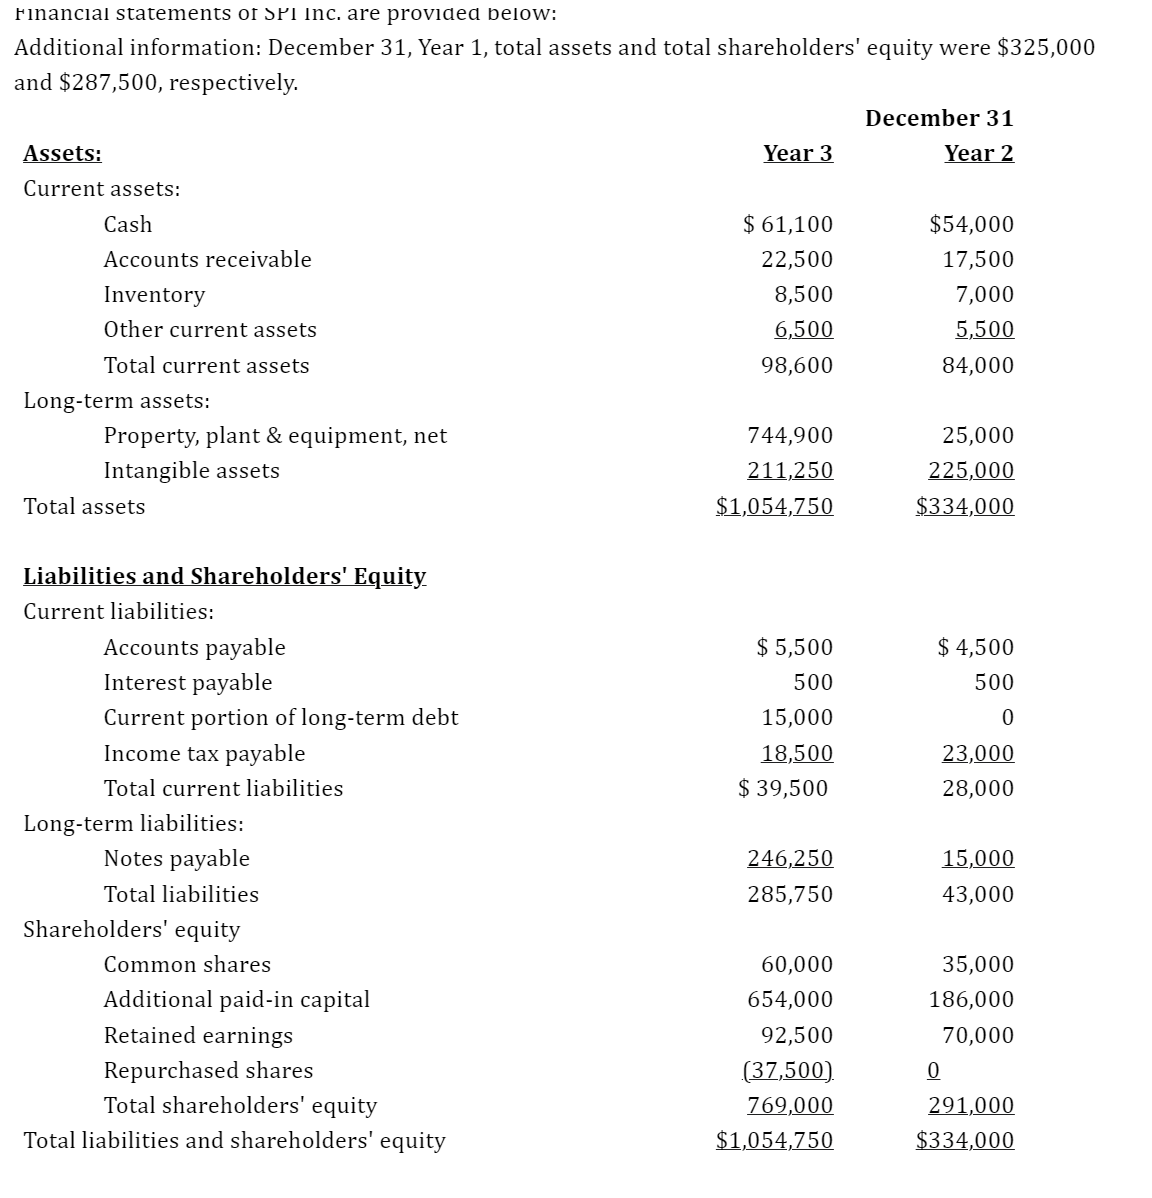
 Hinancial statements of P Inc. are provided below: What is the debt-to-total-assets ratio for Year 3 ? 0.25 0.27 0.34 0.37 What is the debt-to-equity ratio for Year \\( 3 ? \\) 0.25 0.27 0.34 0.37 \\( \\begin{array}{l}2.5 \\\\ 2.8 \\\\ 25.0 \\\\ 28.0\\end{array} \\)
 Step by Step Solution
There are 3 Steps involved in it
Step: 1

Get Instant Access to Expert-Tailored Solutions
See step-by-step solutions with expert insights and AI powered tools for academic success
Step: 2

Step: 3
Ace Your Homework with AI
Get the answers you need in no time with our AI-driven, step-by-step assistance
Get Started
Day Trading Strategies And Risk Management
Authors: Richard N. Williams
1st Edition
979-8863610528