FINC2743 - the questions are in the middle. I have seen some others but I guess he gives different questions. Could you answer mine? Thank you, in advance!
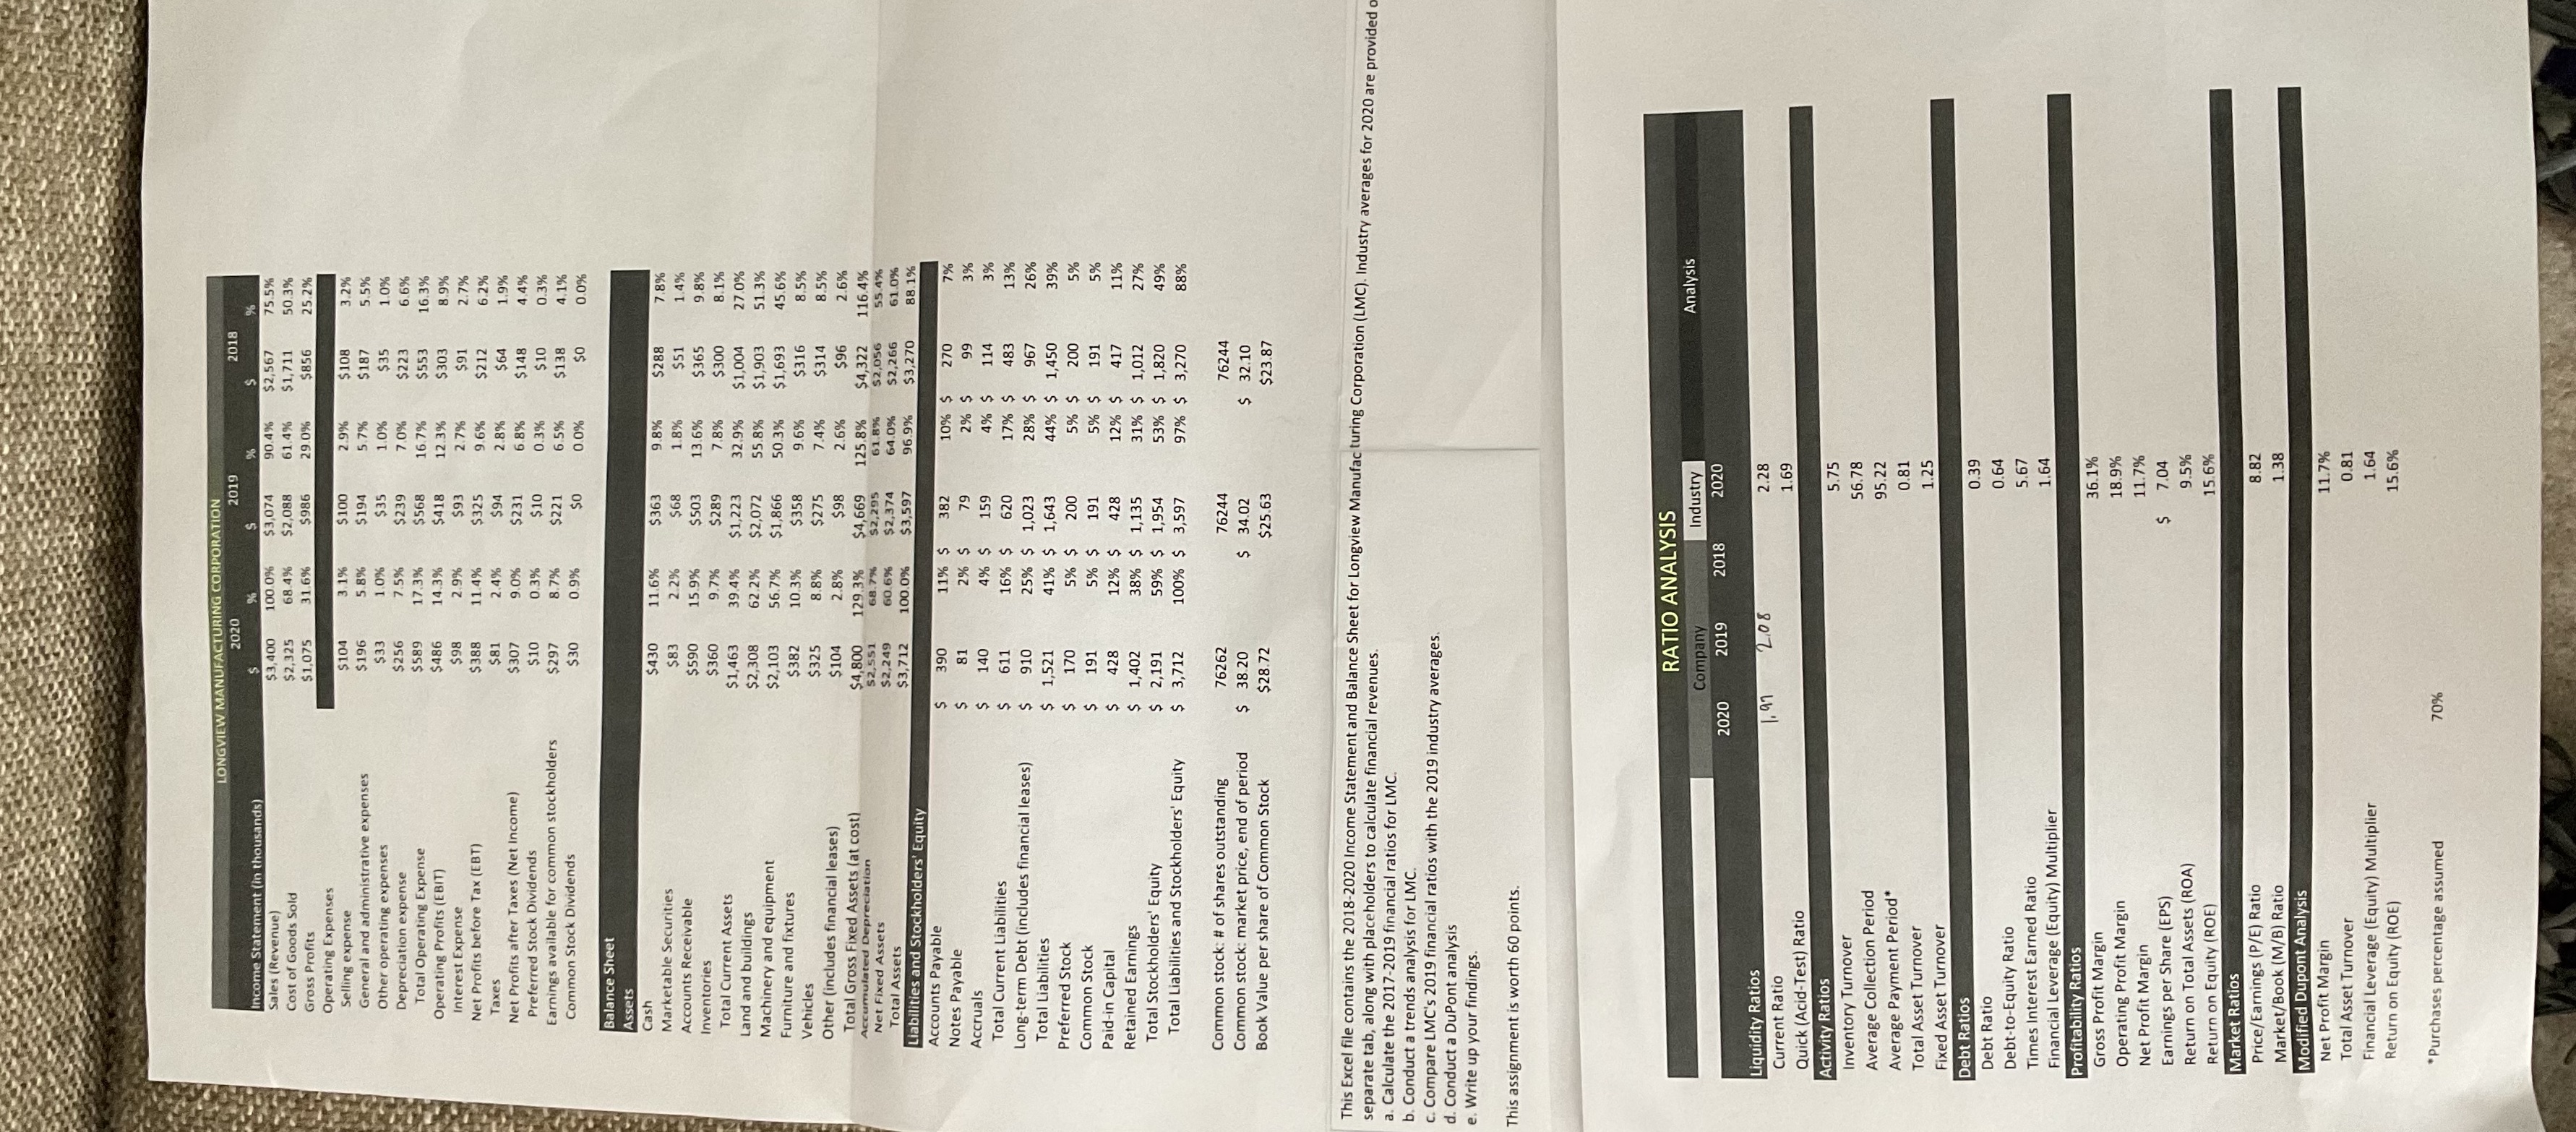
LONGVIEW MANUFACTURING CORPORATION 2020 2019 2018 Income Statement (in thousands) Sales (Revenue) $3,400 100.09 $3,07 90.4 $2,567 75.5% Cost of Goods Sold $2,325 68.4% $2,088 61.4% $1,711 50.3% Gross Profits $1,075 31.6% $986 29.0% $856 25.2% Operating Expenses Selling expense $104 3.19 $100 2.9% $108 3.2% General and administrative expenses $196 5.8% $194 5.7% $187 5.5% Other operating expenses $33 1.0% $35 1.0% $35 1.0% Depreciation expense $256 7.5% $239 7.0% $223 6.6% Total Operating Expense $589 17.3%% $568 16.7% $553 16.3% Operating Profits (EBIT) $486 14.3% $418 12.3% $303 8.9% Interest Expense $98 2,9% $93 2.7% $91 2.7% Net Profits before Tax (EBT) $388 11.4% $325 9.6% $212 6.2% Taxes $81 2.4% $94 2.8%% $64 Net Profits after Taxes (Net Income 9.0% 1.9% $307 $231 6.8% Preferred Stock Dividends $148 4.4% $10 0.3% $10 0.3% $10 Earnings available for common stockholders 0.3% $297 8.7% $221 Common Stock Dividends 6.5% $138 4.1% $30 0.9% So 0.0% SO 0.0% Balance Sheet Assets Cash $430 11.6% $363 Marketable Securities 9.8% $288 $83 7.8% 2.2% $68 Accounts Receivable 1.8% $51 1.4% $590 15.9% Inventories $503 13.6% $365 9.8% $360 9.7% Total Current Assets $289 7.8% $300 8.1% $1,463 39.4% Land and buildings $1,223 32.9% $1,004 27.0% $2,308 62,2% $2,072 Machinery and equipment 55.8% $1,903 51.3% $2,103 56.7% $1,866 Furniture and fixtures 50.3 $1,693 45.6% $382 10.3% Vehicles $358 9.6% $316 8.5% $325 8.8%% $275 $314 Other (includes financial leases) 7.4% 8.5% $104 2.8% $98 2.6% Total Gross Fixed Assets (at cost) $96 2.6% umulated Depreciation $4,80 129.3% 68.7% $4,669 125.8% $4,322 Net Fixed Assets $2,551 116.4% $2,295 Total Assets $2,249 60.6% 61.8% $2,056 55.4% $2,374 64.0% $3,712 100.0% $3.597 $2,266 61.09 Liabilities and Stockholders' Equity 96.9% $3,270 88.19 Accounts Payable 390 Notes Payable 11% $ 382 10% $ 270 81 2% $ Accruals 79 2% $ 99 3% 140 4% $ 159 4% $ 114 Total Current Liabilities 3% 611 16% $ 620 17% $ 483 13% Long-term Debt (includes financial leases) 910 25% $ 1,023 28% $ 967 26% Total Liabilities 1,521 41% $ 1,643 44% $ 1,450 39% Preferred Stock 170 5% $ 200 5% $ 200 Common Stock 5% 191 5% $ 191 5% $ 191 5% Paid-in Capital 428 12% $ 428 12% $ 417 11% Retained Earnings 1,402 38% $ 1,135 31% $ 1,012 27% Total Stockholders' Equity 59% $ 1,954 53% $ 1,820 49% Total Liabilities and Stockholders' Equity $ 3,712 100% $ 3,597 97% $ 3,270 88% Common stock: # of shares outstanding 76262 76244 76244 Common stock: market price, end of period $ 34.02 $ 32.10 Book Value per share of Common Stock $28.72 $25.63 $23.87 This Excel file contains the 2018-2020 Income Statement and Balance Sheet for Longview Manufacturing Corporation (LMC). Industry averages for 2020 are provided separate tab, along with placeholders to calculate financial revenues a. Calculate the 2017-2019 financial ratios for LMC. b. Conduct a trends analysis for LMC. c. Compare LMC's 2019 financial ratios with the 2019 industry averages. d. Conduct a DuPont analysis e. Write up your findings This assignment is worth 60 points. RATIO ANALYSIS Industry Analysis Company 2020 2019 2018 2020 Liquidity Ratios 1. 97 208 2.28 Current Ratio 1.69 Quick (Acid-Test) Ratio Activity Ratios 5.75 Inventory Turnover 56.78 Average Collection Period 95.22 Average Payment Period* 0.81 Total Asset Turnover 1.25 Fixed Asset Turnover Debt Ratios Debt Ratio 0.39 Debt-to-Equity Ratio 0.64 Times Interest Earned Ratio 5.67 Financial Leverage (Equity) Multiplier 1.64 Profitability Ratios Gross Profit Margin 36.19 Operating Profit Margin 18.9% Net Profit Margin 11.7% Earnings per Share (EPS $ Return on Total Assets (ROA) 9.5% Return on Equity (ROE) 15.6% Market Ratios Price/Earnings (P/E) Ratio 8.82 Market/Book (M/B) Ratio 1.38 Modified Dupont Analysis Net Profit Margin 11.7% Total Asset Turnover 0.81 Financial Leverage (Equity) Multiplier 1.64 Return on Equity (ROE) 15.69 *Purchases percentage assumed 70%