Answered step by step
Verified Expert Solution
Question
1 Approved Answer
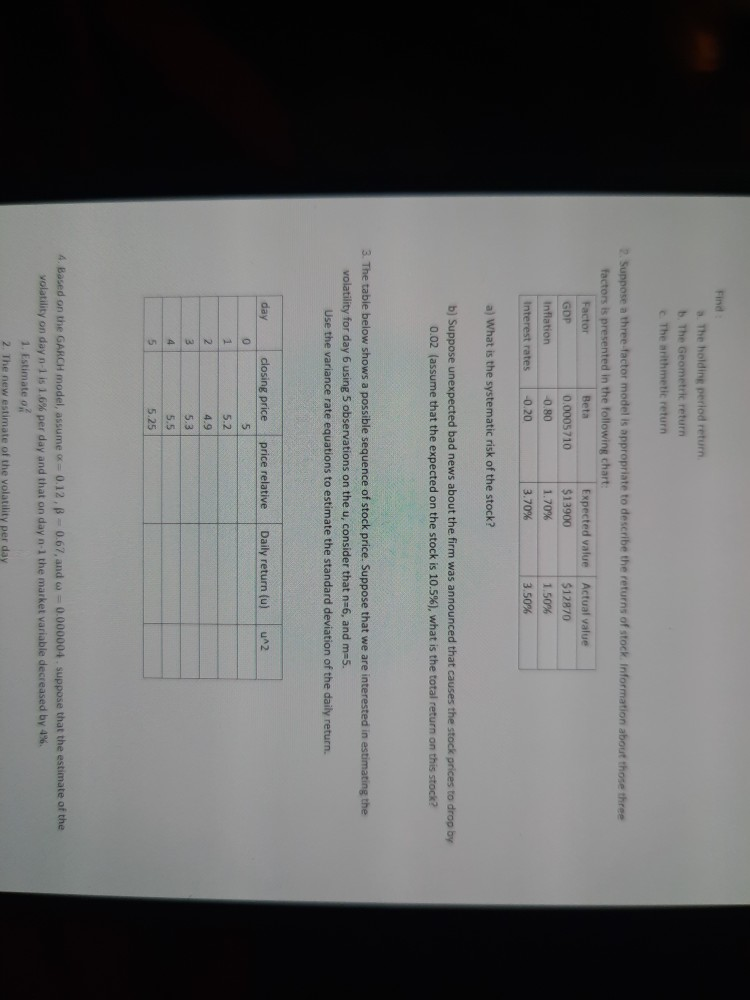
Find 3. The holding period return The Geometric return The arithmetic return 2. Suppose a three factor model is appropriate to describe the returns of

Find 3. The holding period return The Geometric return The arithmetic return 2. Suppose a three factor model is appropriate to describe the returns of stock. Information about those three factors is presented in the following chart: Factor Beta Expected value Actual value GOP 0.0005710 $13900 $12870 Inflation -0.80 1.70% 1.50% Interest rates -0.20 3.70% 3.50% a) What is the systematic risk of the stock? b) Suppose unexpected bad news about the firm was announced that causes the stock prices to drop by 0.02 (assume that the expected on the stock is 10.5%), what is the total return on this stock? 3. The table below shows a possible sequence of stock price. Suppose that we are interested in estimating the volatility for day 6 using 5 observations on the u, consider that n=6, and m-5. Use the variance rate equations to estimate the standard deviation of the daily return. day price relative Daily return (u) UA2 0 closing price 5 5.2 2 3 4.9 5.3 4 5.5 5 5.25 4. Based on the GARCH model, assume =0.12.B -0.67, and w=0.000004. suppose that the estimate of the volatility on day n-1 is 1.6% per day and that on day n-1 the market variable decreased by 4% 1. Estimate o 2. The new estimate of the volatility per day Find 3. The holding period return The Geometric return The arithmetic return 2. Suppose a three factor model is appropriate to describe the returns of stock. Information about those three factors is presented in the following chart: Factor Beta Expected value Actual value GOP 0.0005710 $13900 $12870 Inflation -0.80 1.70% 1.50% Interest rates -0.20 3.70% 3.50% a) What is the systematic risk of the stock? b) Suppose unexpected bad news about the firm was announced that causes the stock prices to drop by 0.02 (assume that the expected on the stock is 10.5%), what is the total return on this stock? 3. The table below shows a possible sequence of stock price. Suppose that we are interested in estimating the volatility for day 6 using 5 observations on the u, consider that n=6, and m-5. Use the variance rate equations to estimate the standard deviation of the daily return. day price relative Daily return (u) UA2 0 closing price 5 5.2 2 3 4.9 5.3 4 5.5 5 5.25 4. Based on the GARCH model, assume =0.12.B -0.67, and w=0.000004. suppose that the estimate of the volatility on day n-1 is 1.6% per day and that on day n-1 the market variable decreased by 4% 1. Estimate o 2. The new estimate of the volatility per day
Step by Step Solution
There are 3 Steps involved in it
Step: 1

Get Instant Access to Expert-Tailored Solutions
See step-by-step solutions with expert insights and AI powered tools for academic success
Step: 2

Step: 3

Ace Your Homework with AI
Get the answers you need in no time with our AI-driven, step-by-step assistance
Get Started


