Find COSTCOs financial statements, including balance sheet, income statement, and cash flow statement. Use the financial statements to construct the common size income statement and common size balance sheet.
Example below for Walmart:
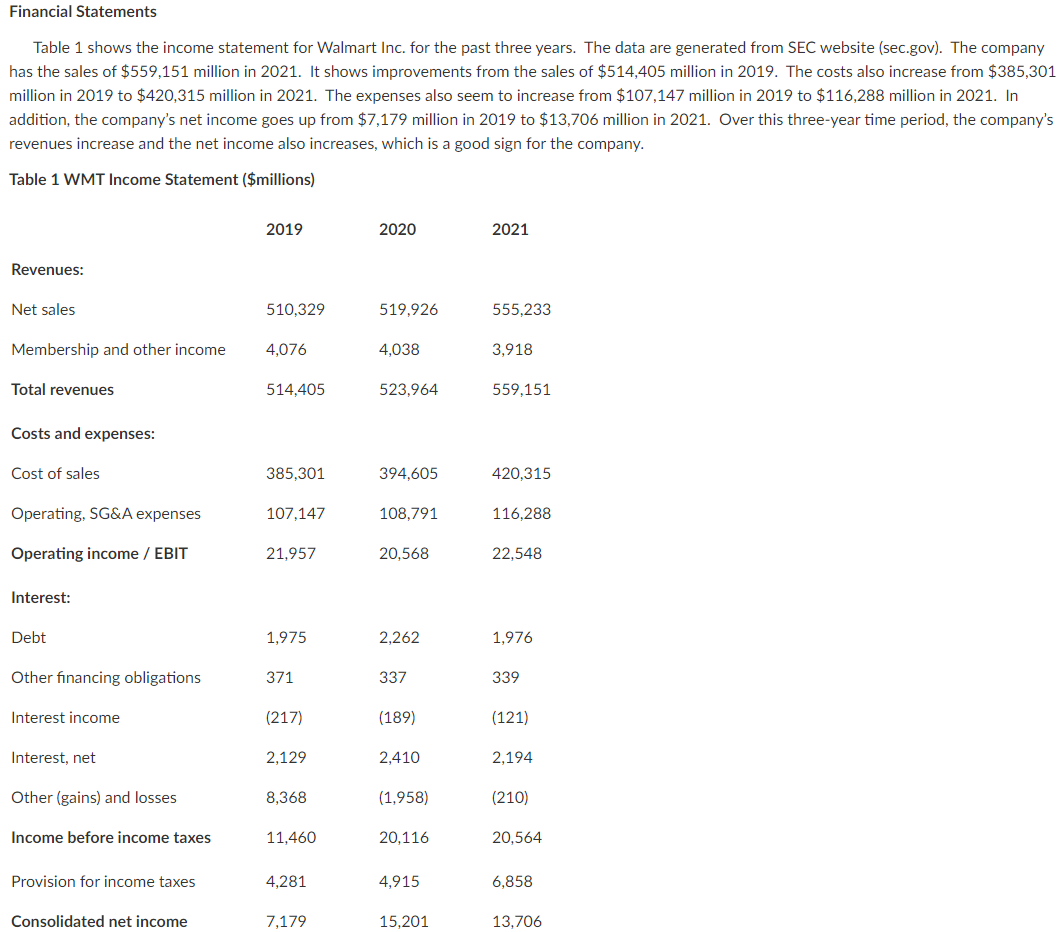
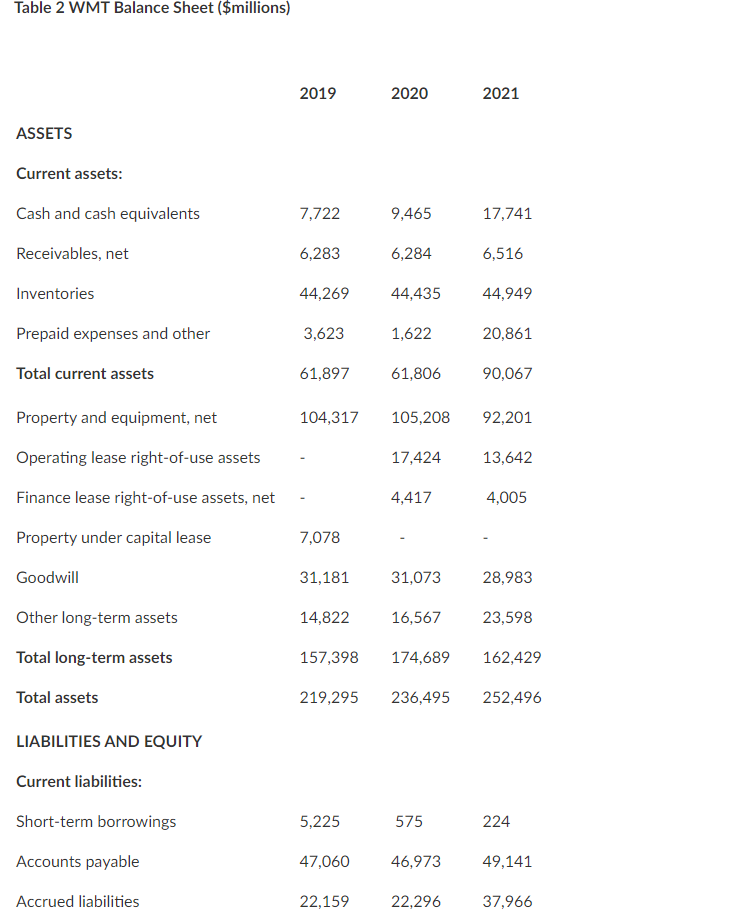
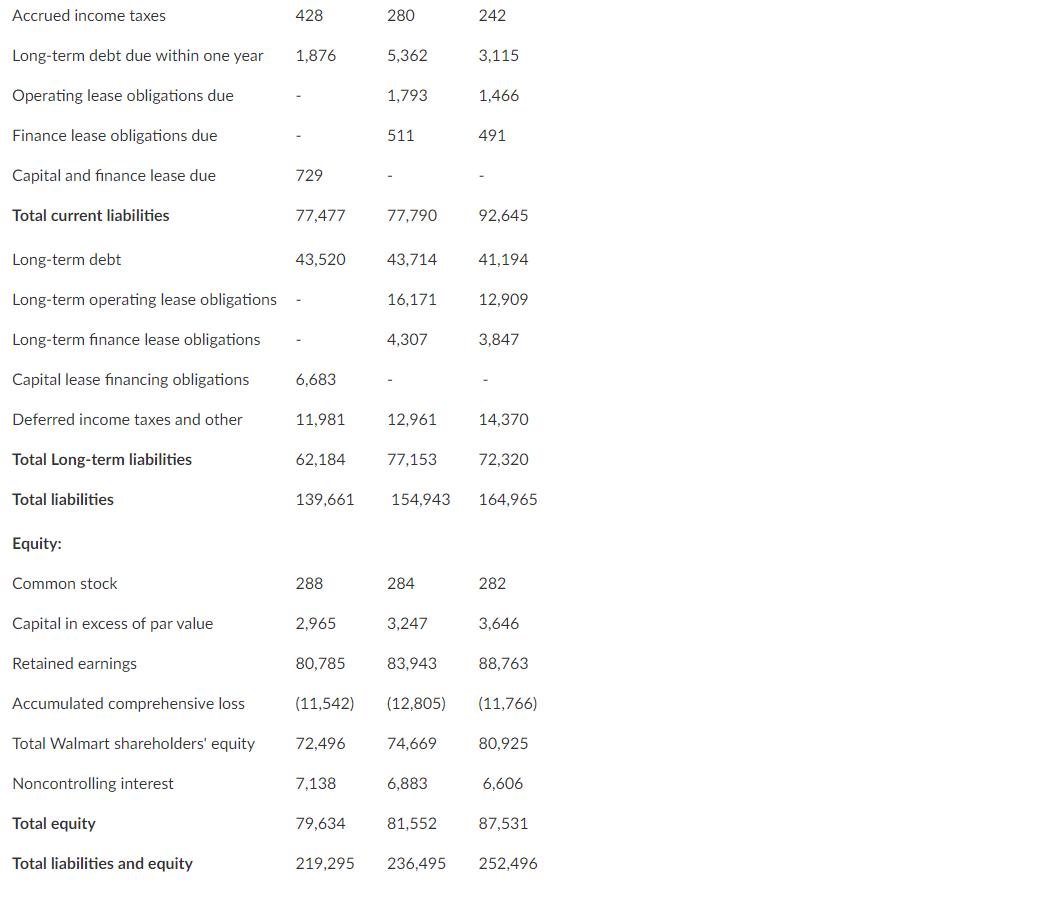
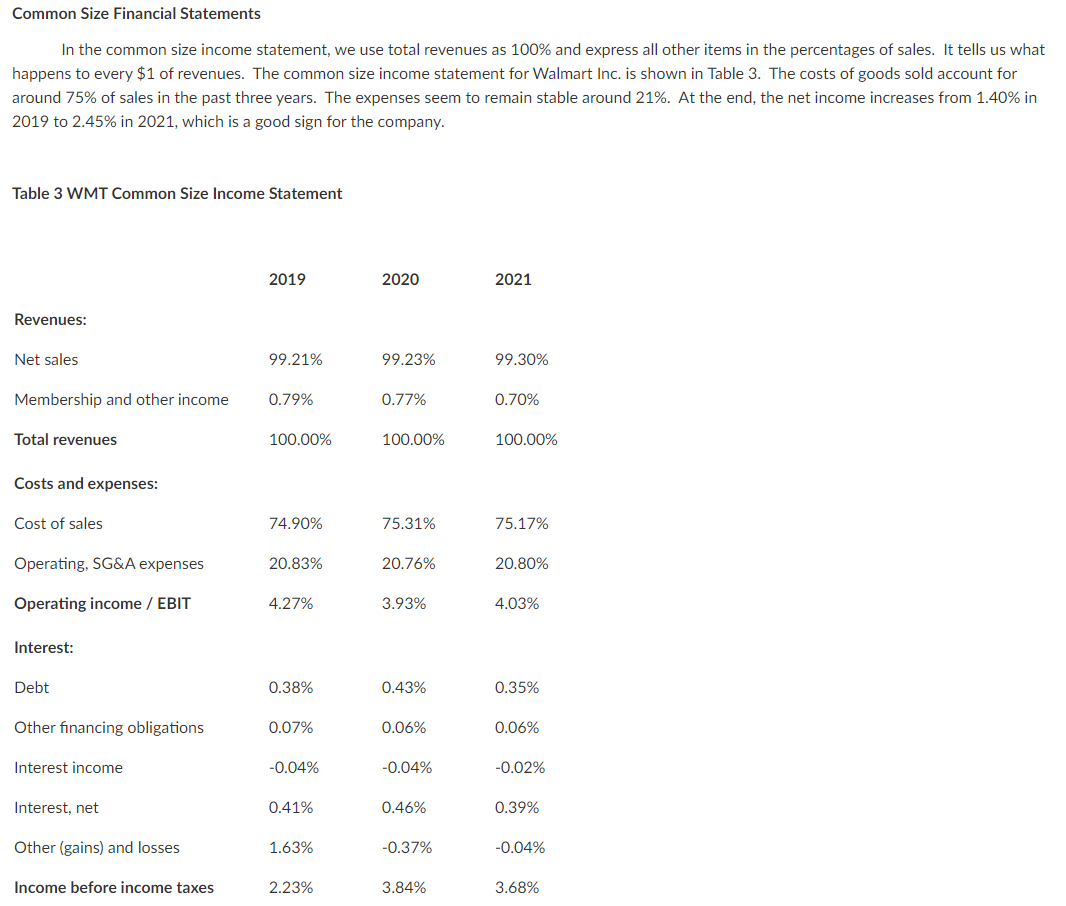
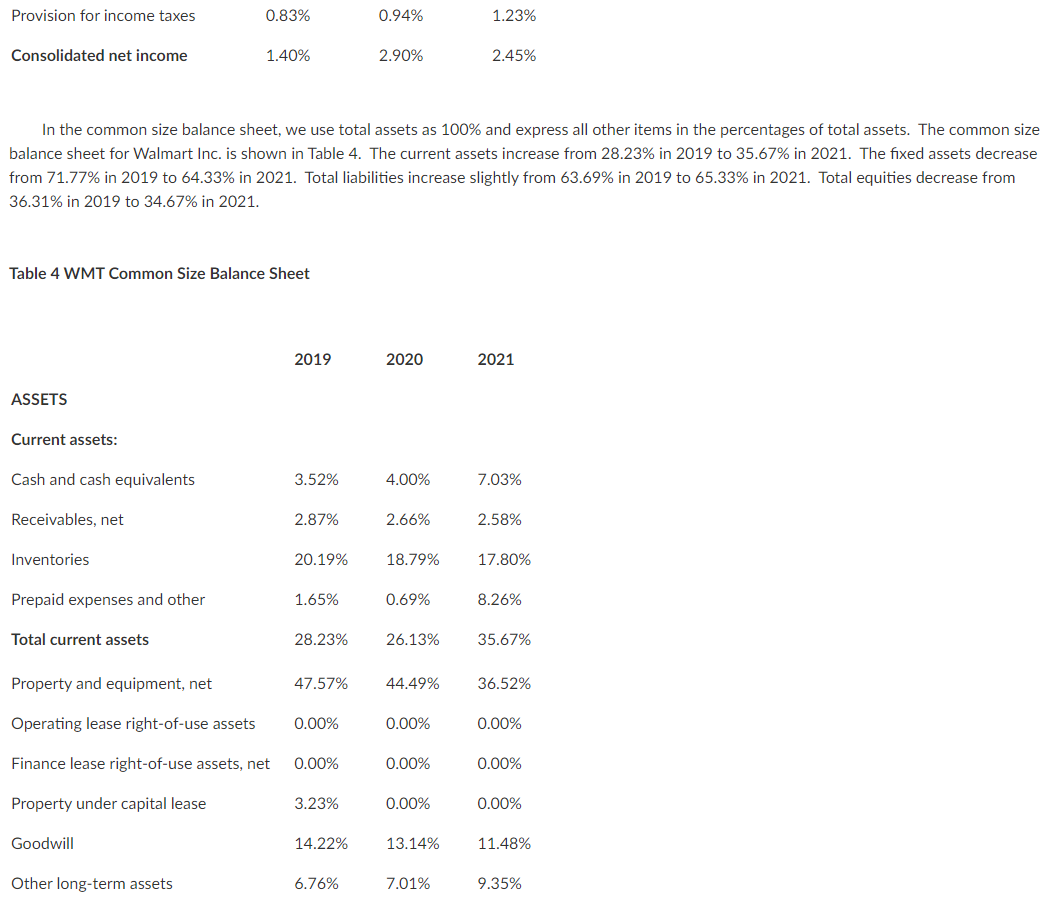
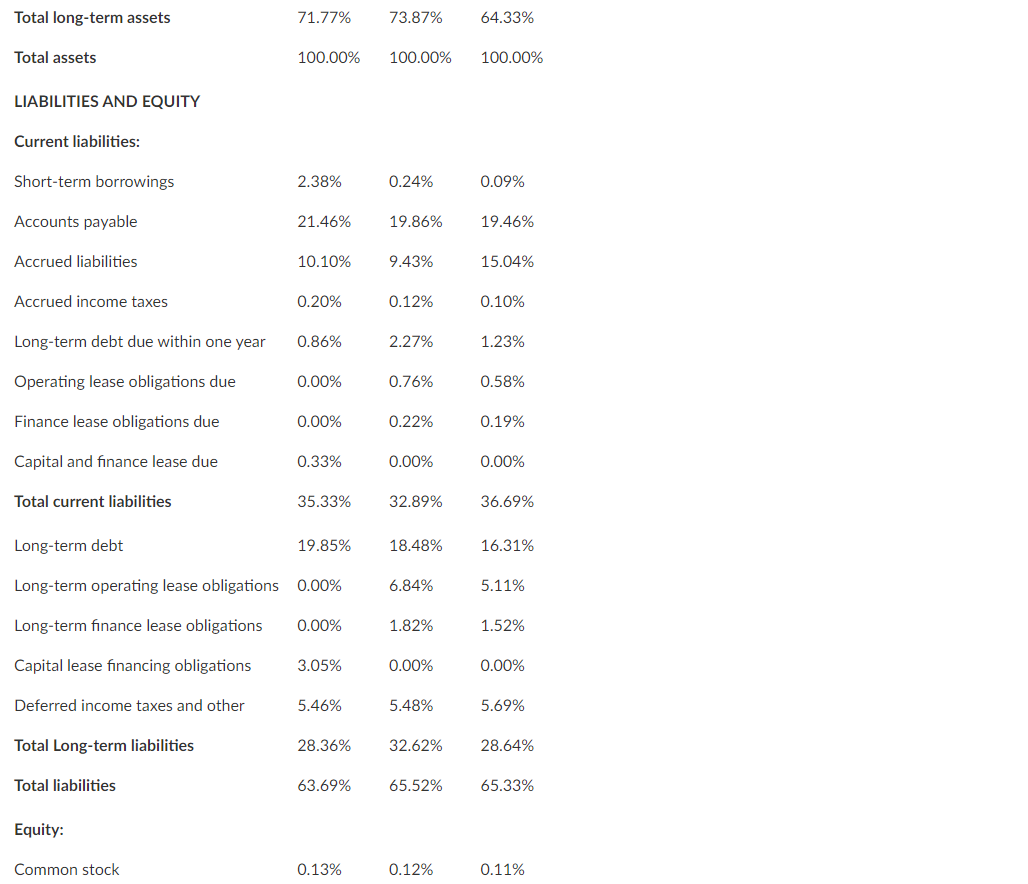
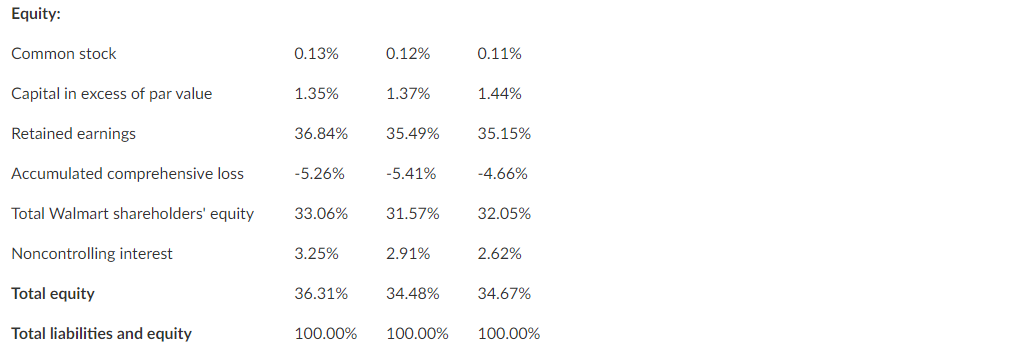
Financial Statements Table 1 shows the income statement for Walmart Inc. for the past three years. The data are generated from SEC website (sec.gov). The company has the sales of $559,151 million in 2021. It shows improvements from the sales of $514,405 million in 2019. The costs also increase from $385,301 million in 2019 to $420,315 million in 2021. The expenses also seem to increase from $107,147 million in 2019 to $116,288 million in 2021. In addition, the company's net income goes up from $7,179 million in 2019 to $13,706 million in 2021. Over this three-year time period, the company's revenues increase and the net income also increases, which is a good sign for the company. Table 1 WMT Income Statement ($millions) 2019 2020 2021 Revenues: Net sales 510,329 519,926 555,233 Membership and other income 4,076 4,038 3,918 Total revenues 514,405 523,964 559,151 Costs and expenses: Cost of sales 385,301 394,605 420,315 Operating, SG&A expenses 107,147 108,791 116,288 Operating income / EBIT 21,957 20,568 22,548 Interest: Debt 1,975 2,262 1,976 Other financing obligations 371 337 339 Interest income (217) (189) (121) Interest, net 2,129 2,410 2,194 Other (gains) and losses 8,368 (1,958) (210) Income before income taxes 11,460 20,116 20,564 Provision for income taxes 4,281 4,915 6,858 Consolidated net income 7,179 15,201 13,706 Table 2 WMT Balance Sheet ($millions) 2019 2020 2021 ASSETS Current assets: Cash and cash equivalents 7,722 9,465 17,741 Receivables, net 6,283 6,284 6,516 Inventories 44,269 44,435 44,949 Prepaid expenses and other 3,623 1,622 20,861 Total current assets 61,897 61,806 90,067 Property and equipment, net 104,317 105,208 92,201 Operating lease right-of-use assets 17,424 13,642 Finance lease right-of-use assets, net 4,417 4,005 Property under capital lease 7,078 Goodwill 31,181 31,073 28,983 Other long-term assets 14,822 16,567 23,598 Total long-term assets 157,398 174,689 162,429 Total assets 219,295 236,495 252,496 LIABILITIES AND EQUITY Current liabilities: Short-term borrowings 5,225 575 224 Accounts payable 47,060 46,973 49,141 Accrued liabilities 22,159 22,296 37,966 Accrued income taxes 428 280 242 Long-term debt due within one year 1,876 5,362 3,115 Operating lease obligations due 1,793 1,466 Finance lease obligations due 511 491 Capital and finance lease due 729 Total current liabilities 77,477 77,790 92,645 Long-term debt 43,520 43,714 41,194 Long-term operating lease obligations 16,171 12,909 Long-term finance lease obligations 4,307 3,847 Capital lease financing obligations 6,683 Deferred income taxes and other 11,981 12,961 14,370 Total Long-term liabilities 62,184 77,153 72,320 Total liabilities 139,661 154.943 164,965 Equity: Common stock 288 284 282 Capital in excess of par value 2,965 3,247 3,646 Retained earnings 80,785 83,943 88.763 Accumulated comprehensive loss (11,542) (12,805) (11,766) Total Walmart shareholders' equity 72,496 74,669 80,925 Noncontrolling interest 7,138 6,883 6,606 Total equity 79,634 81,552 87,531 Total liabilities and equity 219,295 236,495 252,496 Common Size Financial Statements In the common size income statement, we use total revenues as 100% and express all other items in the percentages of sales. It tells us what happens to every $1 of revenues. The common size income statement for Walmart Inc. is shown in Table 3. The costs of goods sold account for around 75% of sales in the past three years. The expenses seem to remain stable around 21%. At the end, the net income increases from 1.40% in 2019 to 2.45% in 2021, which is a good sign for the company. Table 3 WMT Common Size Income Statement 2019 2020 2021 Revenues: Net sales 99.21% 99.23% 99.30% Membership and other income 0.79% 0.77% 0.70% Total revenues 100.00% 100.00% 100.00% Costs and expenses: Cost of sales 74.90% 75.31% 75.17% Operating, SG&A expenses 20.83% 20.76% 20.80% Operating income / EBIT 4.27% 3.93% 4.03% Interest: Debt 0.38% 0.43% 0.35% Other financing obligations 0.07% 0.06% 0.06% Interest income -0.04% -0.04% -0.02% Interest, net 0.41% 0.46% 0.39% Other (gains) and losses 1.63% -0.37% -0.04% Income before income taxes 2.23% 3.84% 3.68% Provision for income taxes 0.83% 0.94% 1.23% Consolidated net income 1.40% 2.90% 2.45% In the common size balance sheet, we use total assets as 100% and express all other items in the percentages of total assets. The common size balance sheet for Walmart Inc. is shown in Table 4. The current assets increase from 28.23% in 2019 to 35.67% in 2021. The fixed assets decrease from 71.77% in 2019 to 64.33% in 2021. Total liabilities increase slightly from 63.69% in 2019 to 65.33% in 2021. Total equities decrease from 36.31% in 2019 to 34.67% in 2021. Table 4 WMT Common Size Balance Sheet 2019 2020 2021 ASSETS Current assets: Cash and cash equivalents 3.52% 4.00% 7.03% Receivables, net 2.87% 2.66% 2.58% Inventories 20.19% 18.79% 17.80% Prepaid expenses and other 1.65% 0.69% 8.26% Total current assets 28.23% 26.13% 35.67% Property and equipment, net 47.57% 44.49% 36.52% Operating lease right-of-use assets 0.00% 0.00% 0.00% Finance lease right-of-use assets, net 0.00% 0.00% 0.00% Property under capital lease 3.23% 0.00% 0.00% Goodwill 14.22% 13.14% 11.48% Other long-term assets 6.76% 7.01% 9.35% Total long-term assets 71.77% 73.87% 64.33% Total assets 100.00% 100.00% 100.00% LIABILITIES AND EQUITY Current liabilities: Short-term borrowings 2.38% 0.24% 0.09% Accounts payable 21.46% 19.86% 19.46% Accrued liabilities 10.10% 9.43% 15.04% Accrued income taxes 0.20% 0.12% 0.10% Long-term debt due within one year 0.86% 2.27% 1.23% Operating lease obligations due 0.00% 0.76% 0.58% Finance lease obligations due 0.00% 0.22% 0.19% Capital and finance lease due 0.33% 0.00% 0.00% Total current liabilities 35.33% 32.89% 36.69% Long-term debt 19.85% 18.48% 16.31% Long-term operating lease obligations 0.00% 6.84% 5.11% Long-term finance lease obligations 0.00% 1.82% 1.52% Capital lease financing obligations 3.05% 0.00% 0.00% Deferred income taxes and other 5.46% 5.48% 5.69% Total Long-term liabilities 28.36% 32.62% 28.64% Total liabilities 63.69% 65.52% 65.33% Equity: Common stock 0.13% 0.12% 0.11% Equity: Common stock 0.13% 0.12% 0.11% Capital in excess of par value 1.35% 1.37% 1.44% Retained earnings 36.84% 35.49% 35.15% Accumulated comprehensive loss -5.26% -5.41% -4.66% Total Walmart shareholders' equity 33.06% 31.57% 32.05% Noncontrolling interest 3.25% 2.91% 2.62% Total equity 36.31% 34.48% 34.67% Total liabilities and equity 100.00% 100.00% 100.00% Financial Statements Table 1 shows the income statement for Walmart Inc. for the past three years. The data are generated from SEC website (sec.gov). The company has the sales of $559,151 million in 2021. It shows improvements from the sales of $514,405 million in 2019. The costs also increase from $385,301 million in 2019 to $420,315 million in 2021. The expenses also seem to increase from $107,147 million in 2019 to $116,288 million in 2021. In addition, the company's net income goes up from $7,179 million in 2019 to $13,706 million in 2021. Over this three-year time period, the company's revenues increase and the net income also increases, which is a good sign for the company. Table 1 WMT Income Statement ($millions) 2019 2020 2021 Revenues: Net sales 510,329 519,926 555,233 Membership and other income 4,076 4,038 3,918 Total revenues 514,405 523,964 559,151 Costs and expenses: Cost of sales 385,301 394,605 420,315 Operating, SG&A expenses 107,147 108,791 116,288 Operating income / EBIT 21,957 20,568 22,548 Interest: Debt 1,975 2,262 1,976 Other financing obligations 371 337 339 Interest income (217) (189) (121) Interest, net 2,129 2,410 2,194 Other (gains) and losses 8,368 (1,958) (210) Income before income taxes 11,460 20,116 20,564 Provision for income taxes 4,281 4,915 6,858 Consolidated net income 7,179 15,201 13,706 Table 2 WMT Balance Sheet ($millions) 2019 2020 2021 ASSETS Current assets: Cash and cash equivalents 7,722 9,465 17,741 Receivables, net 6,283 6,284 6,516 Inventories 44,269 44,435 44,949 Prepaid expenses and other 3,623 1,622 20,861 Total current assets 61,897 61,806 90,067 Property and equipment, net 104,317 105,208 92,201 Operating lease right-of-use assets 17,424 13,642 Finance lease right-of-use assets, net 4,417 4,005 Property under capital lease 7,078 Goodwill 31,181 31,073 28,983 Other long-term assets 14,822 16,567 23,598 Total long-term assets 157,398 174,689 162,429 Total assets 219,295 236,495 252,496 LIABILITIES AND EQUITY Current liabilities: Short-term borrowings 5,225 575 224 Accounts payable 47,060 46,973 49,141 Accrued liabilities 22,159 22,296 37,966 Accrued income taxes 428 280 242 Long-term debt due within one year 1,876 5,362 3,115 Operating lease obligations due 1,793 1,466 Finance lease obligations due 511 491 Capital and finance lease due 729 Total current liabilities 77,477 77,790 92,645 Long-term debt 43,520 43,714 41,194 Long-term operating lease obligations 16,171 12,909 Long-term finance lease obligations 4,307 3,847 Capital lease financing obligations 6,683 Deferred income taxes and other 11,981 12,961 14,370 Total Long-term liabilities 62,184 77,153 72,320 Total liabilities 139,661 154.943 164,965 Equity: Common stock 288 284 282 Capital in excess of par value 2,965 3,247 3,646 Retained earnings 80,785 83,943 88.763 Accumulated comprehensive loss (11,542) (12,805) (11,766) Total Walmart shareholders' equity 72,496 74,669 80,925 Noncontrolling interest 7,138 6,883 6,606 Total equity 79,634 81,552 87,531 Total liabilities and equity 219,295 236,495 252,496 Common Size Financial Statements In the common size income statement, we use total revenues as 100% and express all other items in the percentages of sales. It tells us what happens to every $1 of revenues. The common size income statement for Walmart Inc. is shown in Table 3. The costs of goods sold account for around 75% of sales in the past three years. The expenses seem to remain stable around 21%. At the end, the net income increases from 1.40% in 2019 to 2.45% in 2021, which is a good sign for the company. Table 3 WMT Common Size Income Statement 2019 2020 2021 Revenues: Net sales 99.21% 99.23% 99.30% Membership and other income 0.79% 0.77% 0.70% Total revenues 100.00% 100.00% 100.00% Costs and expenses: Cost of sales 74.90% 75.31% 75.17% Operating, SG&A expenses 20.83% 20.76% 20.80% Operating income / EBIT 4.27% 3.93% 4.03% Interest: Debt 0.38% 0.43% 0.35% Other financing obligations 0.07% 0.06% 0.06% Interest income -0.04% -0.04% -0.02% Interest, net 0.41% 0.46% 0.39% Other (gains) and losses 1.63% -0.37% -0.04% Income before income taxes 2.23% 3.84% 3.68% Provision for income taxes 0.83% 0.94% 1.23% Consolidated net income 1.40% 2.90% 2.45% In the common size balance sheet, we use total assets as 100% and express all other items in the percentages of total assets. The common size balance sheet for Walmart Inc. is shown in Table 4. The current assets increase from 28.23% in 2019 to 35.67% in 2021. The fixed assets decrease from 71.77% in 2019 to 64.33% in 2021. Total liabilities increase slightly from 63.69% in 2019 to 65.33% in 2021. Total equities decrease from 36.31% in 2019 to 34.67% in 2021. Table 4 WMT Common Size Balance Sheet 2019 2020 2021 ASSETS Current assets: Cash and cash equivalents 3.52% 4.00% 7.03% Receivables, net 2.87% 2.66% 2.58% Inventories 20.19% 18.79% 17.80% Prepaid expenses and other 1.65% 0.69% 8.26% Total current assets 28.23% 26.13% 35.67% Property and equipment, net 47.57% 44.49% 36.52% Operating lease right-of-use assets 0.00% 0.00% 0.00% Finance lease right-of-use assets, net 0.00% 0.00% 0.00% Property under capital lease 3.23% 0.00% 0.00% Goodwill 14.22% 13.14% 11.48% Other long-term assets 6.76% 7.01% 9.35% Total long-term assets 71.77% 73.87% 64.33% Total assets 100.00% 100.00% 100.00% LIABILITIES AND EQUITY Current liabilities: Short-term borrowings 2.38% 0.24% 0.09% Accounts payable 21.46% 19.86% 19.46% Accrued liabilities 10.10% 9.43% 15.04% Accrued income taxes 0.20% 0.12% 0.10% Long-term debt due within one year 0.86% 2.27% 1.23% Operating lease obligations due 0.00% 0.76% 0.58% Finance lease obligations due 0.00% 0.22% 0.19% Capital and finance lease due 0.33% 0.00% 0.00% Total current liabilities 35.33% 32.89% 36.69% Long-term debt 19.85% 18.48% 16.31% Long-term operating lease obligations 0.00% 6.84% 5.11% Long-term finance lease obligations 0.00% 1.82% 1.52% Capital lease financing obligations 3.05% 0.00% 0.00% Deferred income taxes and other 5.46% 5.48% 5.69% Total Long-term liabilities 28.36% 32.62% 28.64% Total liabilities 63.69% 65.52% 65.33% Equity: Common stock 0.13% 0.12% 0.11% Equity: Common stock 0.13% 0.12% 0.11% Capital in excess of par value 1.35% 1.37% 1.44% Retained earnings 36.84% 35.49% 35.15% Accumulated comprehensive loss -5.26% -5.41% -4.66% Total Walmart shareholders' equity 33.06% 31.57% 32.05% Noncontrolling interest 3.25% 2.91% 2.62% Total equity 36.31% 34.48% 34.67% Total liabilities and equity 100.00% 100.00% 100.00%