Find Fixed FOH ( budget/spending & volume) variance, step plz?
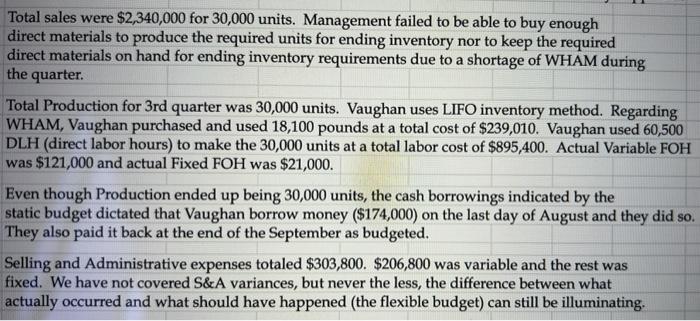
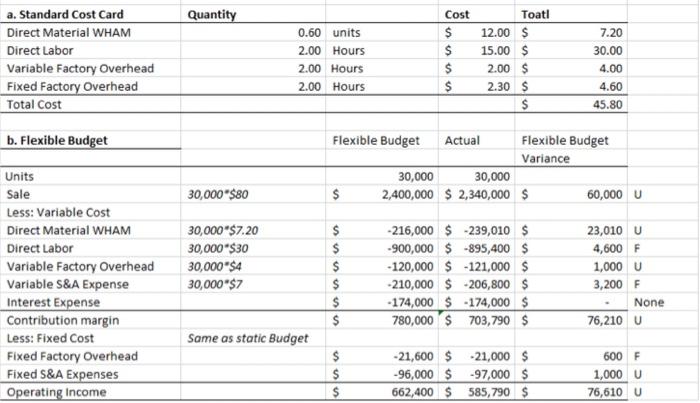
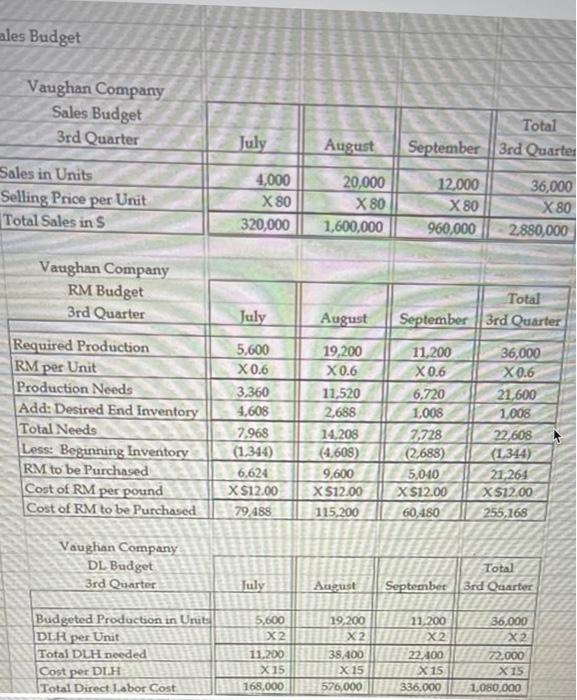
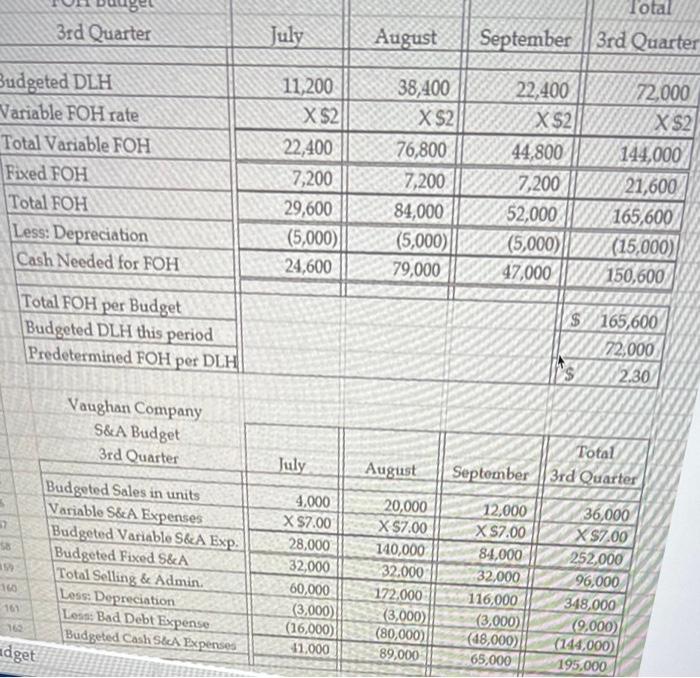
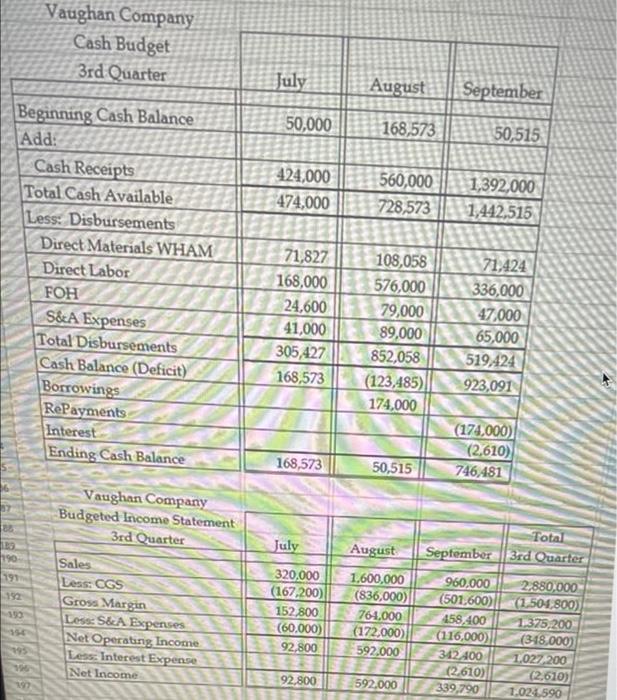
Total sales were $2,340,000 for 30,000 units. Management failed to be able to buy enough direct materials to produce the required units for ending inventory nor to keep the required direct materials on hand for ending inventory requirements due to a shortage of WHAM during the quarter. Total Production for 3rd quarter was 30,000 units. Vaughan uses LIFO inventory method. Regarding WHAM, Vaughan purchased and used 18,100 pounds at a total cost of $239,010. Vaughan used 60,500 DLH (direct labor hours) to make the 30,000 units at a total labor cost of $895,400. Actual Variable FOH was $121,000 and actual Fixed FOH was $21,000. Even though Production ended up being 30,000 units, the cash borrowings indicated by the static budget dictated that Vaughan borrow money ($174,000) on the last day of August and they did so. They also paid it back at the end of the September as budgeted. Selling and Administrative expenses totaled $303,800. $206,800 was variable and the rest was fixed. We have not covered S&A variances, but never the less, the difference between what actually occurred and what should have happened (the flexible budget) can still be illuminating. Quantity Cost 0.60 units a. Standard Cost Card Direct Material WHAM Direct Labor Variable Factory Overhead Fixed Factory Overhead Total Cost 2.00 Hours 2.00 Hours 2.00 Hours $ $ $ Toati 12.00 $ 15.00 $ 2.00 $ 2.30 $ $ 7.20 30.00 4.00 4.60 45.80 b. Flexible Budget Flexible Budget Actual Flexible Budget Variance 30,000 30,000 $ 2,400,000 $ 2,340,000 $ 60,000 U 30,000 $80 Units Sale Less: Variable Cost Direct Material WHAM Direct Labor Variable Factory Overhead Variable S&A Expense Interest Expense Contribution margin Less: Fixed Cost Fixed Factory Overhead Fixed S&A Expenses Operating Income 30,000 $7.20 30,000 $30 30,000 $4 30,000"$7 $ $ $ $ $ $ -216,000 $ -239,010 $ -900,000 $ -895,400 $ -120,000 $ 121,000 $ 210,000 $206,800 $ - 174,000 $ 174,000 $ 780,000 $ 703,790 $ 23,010 U 4,600 F 1,000U 3,200 F None 76,210 U ulu Same as static Budget $ $ $ uu -21,600 $ 21,000 $ -96,000 $ 97,000 $ 662,400 $ 585,790 $ 600 F 1,000 U 76,610 V sales Budget Vaughan Company Sales Budget 3rd Quarter July Total September 3rd Quarter August Sales in Units Selling Price per Unit Total Sales in s 4,000 X 80 320,000 20,000 X 80 1,600,000 12,000 X 80 960,000 36,000 X 80 2.880,000 Vaughan Company RM Budget 3rd Quarter July Total September | 3rd Quarter August Required Production RM per Unit Production Needs Add: Desired End Inventory Total Needs Less: Beginning Inventory RM to be Purchased Cost of RM per pound Cost of RM to be purchased 5,600 X0.6 3,360 4,608 7.968 (1.344) 6,624 X $12.00 79.488 19,200 X0.6 11,520 2,688 14,208 (4.608) 9,600 X $12.00 115,200 11,200 X 0.6 6,720 1,008 2,728 (2.688) 5,040 X $12.00 60,450 36,000 X 0.6 21,600 1,008 22,608 (1.344) 21,264 X$12.00 255,168 Vaughan Company DL Budget 3rd Quarter July Total 3rd Quarter August September X2 Budgeted Production in Urut 5,600 DLA per Unit X2 Total DLH needed DLL 11.200 Cost per DLH X 15 Total Direct Labor Cost 31168,000 19,200 11.200 36.000 X2 X2 38.400 22.400 72.000 X 15 X 15 X 15 576,000 1 336,000 1 1,050,000 Be 3rd Quarter July Total September || 3rd Quarter August Budgeted DLH Variable FOH rate Total Variable FOH Fixed FOH Total FOH Less: Depreciation Cash Needed for FOH 11,200 X $2 22,400 7,200 29,600 (5,000) 24,600 38,400 22,400 72,000 X $2 X $2 X $2 76,800 44,800 144,000 7,200 7,200 21,600 84,000 52,000 165,600 (5,000)|(5,000)||(15,000) 79,000 47,000 150,600 Total FOH per Budget Budgeted DLH this period Predetermined FOH per DLH $ 165,600 12,000 Irs 2.30 Vaughan Company S&A Budget 3rd Quarter July August Total 3rd Quarter September 3 2 58 Budgeted Sales in units Variable S&A Expenses Budgeted Variable S&A Exp. Budgeted Fixed S&A Total Selling & Admin Less: Depreciation Lenn: Bad Debt Expense Budgeted Cash S&A Expenses adget 4,000 X $7.00 28.000 32,000 60,000 (3,000) (16,000) 41.000 20,000 X $7.00 140,000 32.000 172.000 (3.000) (80,000) 89,000 160 12,000 X 7.00 84,000 32,000 116,000 (3,000) (48,000) 65,000 36,000 X $7.00 252,000 96,000 348,000 (9,000) (144,000 195.000 161 Vaughan Company Cash Budget 3rd Quarter July August September 50,000 168,573 50,515 424,000 474,000 560,000 728,573 1,392,000 1,442,515 Beginning Cash Balance Add: Cash Receipts Total Cash Available Less: Disbursements Direct Materials WHAM Direct Labor FOH S&A Expenses Total Disbursements Cash Balance (Deficit) Borrowings RePayments Interest Ending Cash Balance 71,827 168,000 24,600 41,000 305,427 168,573 108,058 576,000 79,000 89,000 852,058 (123,485) 174,000 71,424 336,000 47.000 65,000 519424 923,091 (174,000) (2,610) 746,481 168,573 50,515 Vaughan Company Budgeted Income Statement 3rd Quarter 125 July August Total September 3rd Quarter 19 190 Sales Less: CGS Gross Margin Less: S&A Expenses Net Operating Income Less: Interest Expense Net Income 320,000 (167,200) 152 800 (60.000) 92,800 1.600,000 (836,000) 764,000 (172.000 592.000 960.000 (501,600) 458,400 (116,000) 342 400 (2610) 339,790 2.880,000 (1.504.800) 1375,200 (318,000) 1,027200 (2.610) 1.024.590 92.800 592.000


