Answered step by step
Verified Expert Solution
Question
1 Approved Answer
Find out the ratio analysis for minimum 5 to 6 years which started in 2000 and show it in Excel with explanation. please add also
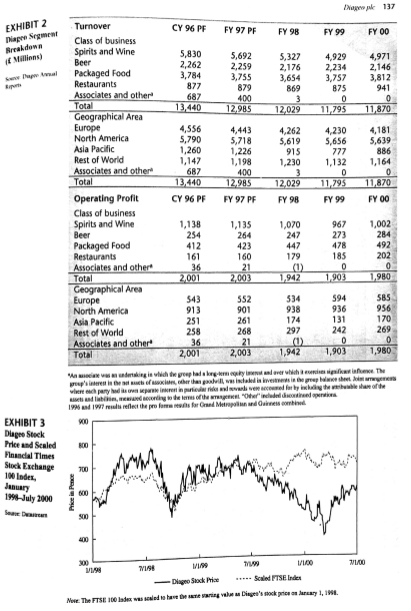 Find out the ratio analysis for minimum 5 to 6 years which started in 2000 and show it in Excel with explanation.
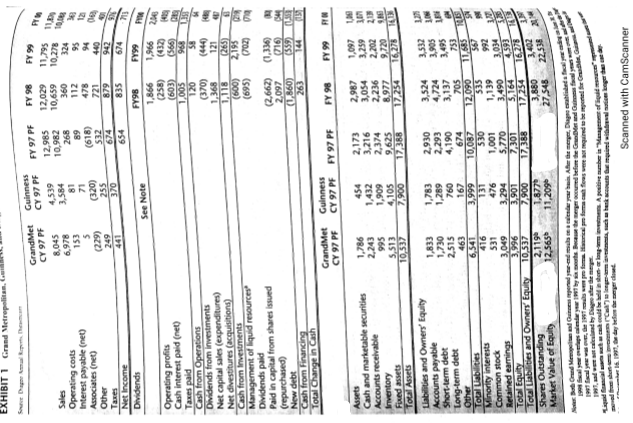
please add also the chart.
What you need kindly explain me
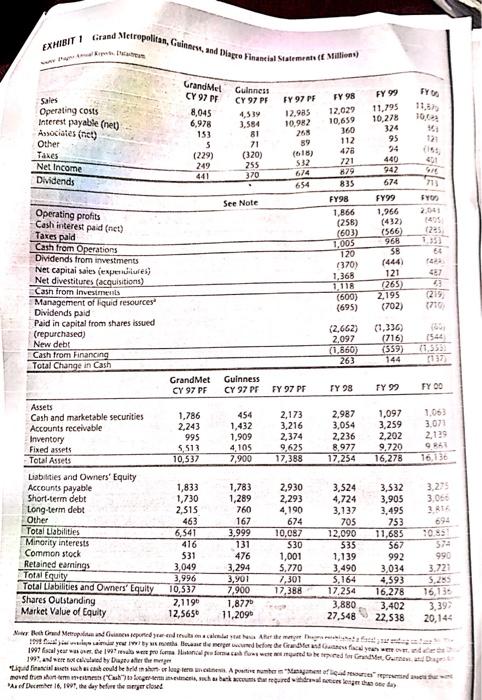
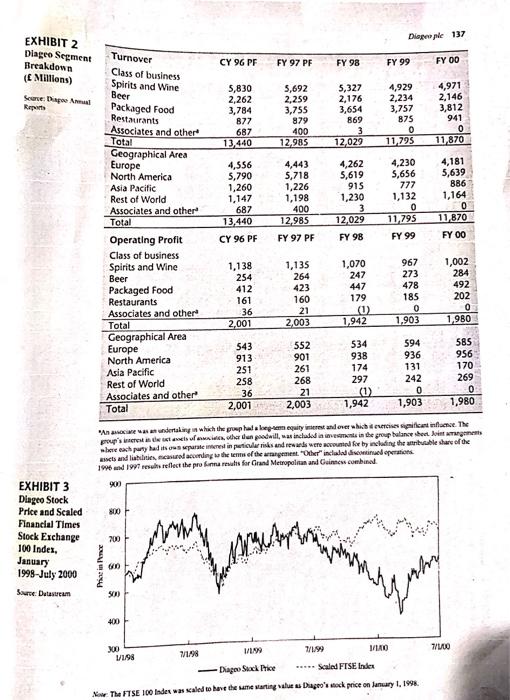
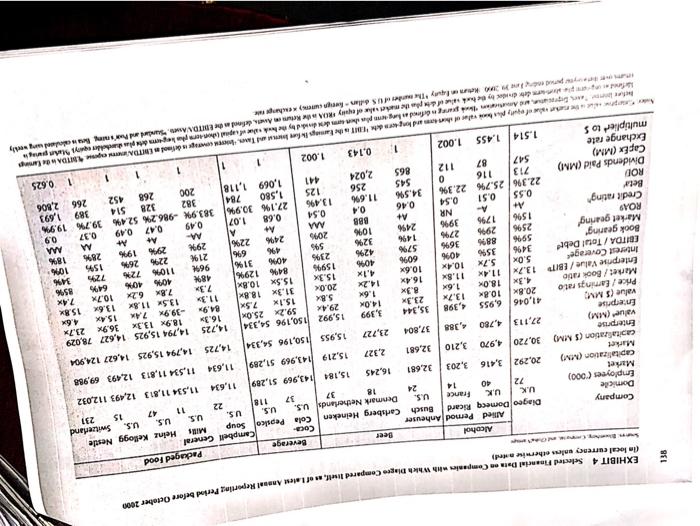
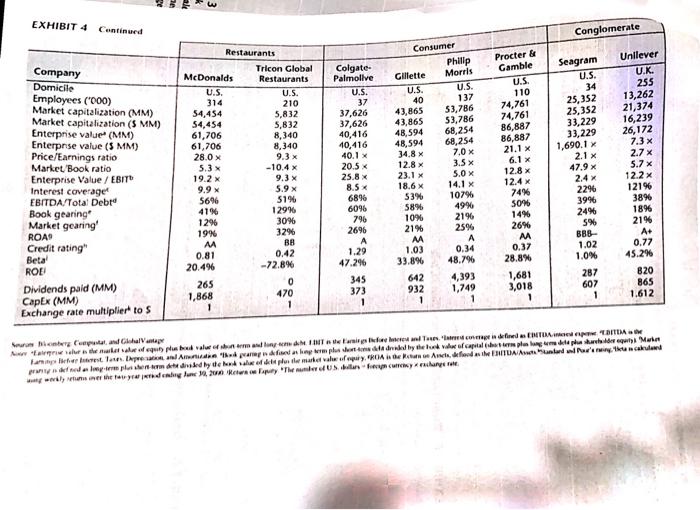
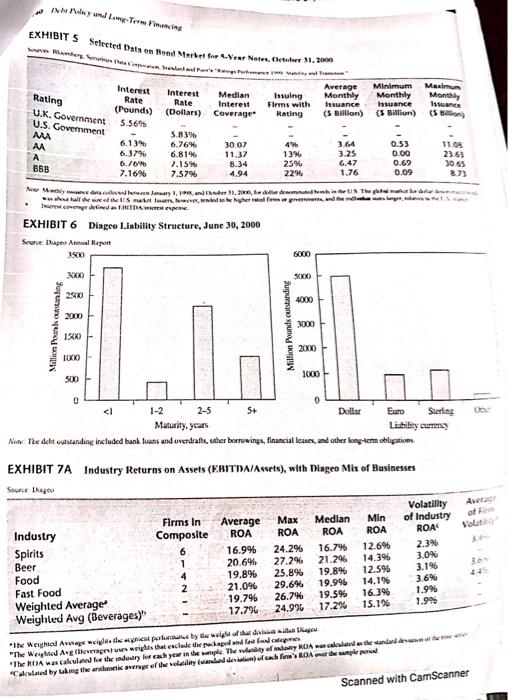
I can't make it more clear. Hopefully this time you will understand all event's.. Once again now you don't need to ratio analysis just do the "Analysis of the economy" Instruction: you have to do first forecast of the economy for next few years and explain it..
Thank you
Simple you have to analysis THE ECONOMY.. how you do it- you should find out the forecast last few years and analysis base on this forecast.. Thats it..
Follow the only last 4 pictures or tell me how to upload... I'm really tried letting you imform..
EXHIBIT 2 IngreSegment Madona 1 Millions) 4,971 875 12.985 Il 137 Turnover CY 96 PF FY 97 PF FY 98 FY 99 FY OO Class of business Spirits and Wine 5,830 Beer 5,692 5,327 4,929 2,262 2,259 2,176 Packaged Food 2,234 2,146 3,784 Restaurants 3,755 3,654 3,757 3,812 877 879 869 941 Associates and other 687 400 3 0 0 Total 13.440 Geographical Area 12,029 11,795 11,870 Europe 4,556 4,443 4,262 4,230 4,181 North America 5,790 5,718 5,619 5,656 5,639 Asia Pacific 1,260 1,226 915 777 886 Rest of World 1,147 1,198 1,230 1,132 1,164 Associates and other 687 400 0 0 Total 13,440 12.985 12,029 11,795 11,870 Operating Profit CY 96 PF FY 97 PF FY 98 FY 99 FY00 Class of business Spirits and Wine 1,138 1,135 1,070 1,002 Beer 254 264 247 273 284 Packaged Food 412 423 478 492 Restaurants 161 160 179 185 202 Associates and other 36 21 (0) 0 0 Total 2,001 2,003 1,942 1903 1.980 Geographical Area Europe 543 552 534 594 585 North America 913 938 936 956 Asia Pacific 251 261 174 131 Rest of World 258 268 297 269 Associates and other 36 21 (0) 0 0 Total 2,001 2,003 1,942 1,903 1,980 ding is wichtigroup halagay. The prepare the other than it is lives in the prepletenes hanya mendaftly wg the weathe was de empreendedores 19 Wres reflect the professed Meng diesel 200 967 447 901 170 242 EXHIBIT 3 Dlagro Stock Price and Sealed Paancial Times Stock Exchange 1 Indies 700 1991-July 2000 600 mm 00 1100 1998 300 199 TV 1100 Dlugo Stack Price Sated FTSE Index Me: The FTSE 100 lades essed to have the realm Diyet's creencary 1, 1998 EXHIBIT 1 Grand Metropolitan. FY 98 12,029 10,659 FY 99 11,795 Grand Met CY 97 PF 8,045 6,978 153 5 (229) Guinness CY 97 PF 4,539 3,584 81 71 (320) 255 370 360 Sales Operating costs Interest payable (net) Associates (net) Other Taxes Net Income Dividends 10,278 0.013 FY 97 PF 12,985 10,982 268 89 (618) 532 674 654 324 95 94 112 478 721 879 835 249 441 942 674 FY99 1,966 See Note FY98 1,866 (258) (603) 1.005 Operating profits Cash interest paid (net) Taxes paid cash from Operations Dividends from investments Net capital sales (expenditures) Net divestitures (acquisitions) Cash from Investments Management of liquid resources Dividends paid Paid in capital from shares issued Crepurchased) New debt Cash from Financing Total Change in Cash (370) 1,368 1,118 (600) (695) (566) 968 58 (444) 121 (265) 2,195 (702) (2,662) 2,097 0.360) 263 (1,336) (716) (5590 1 Grand Met CY 97 PF Guinness CY 97 PF FY 97 PF FY 98 FY 99 LAN 1,786 2,243 995 5,513 10,337 1,432 1,909 $105 2,173 3,216 2,374 9,625 17,368 2,987 3,054 2,236 8,977 17,254 1,097 3,259 2,202 9.220 7,900 Assets Cash and marketable securities Accounts receivable Inventory Fixed assets Total Assets Liabilities and Owners' Equity Accounts payable Short-term debe Long-term debe Other Total Liabilities Minority interests Common stock Retained earnings Total Equity Total Liabilities and Owners Equity Shares Outstanding Market Value of Equity LIN IR 1,833 1,730 2,515 463 6,541 416 531 3.049 3,532 3,905 3,495 253 11,685 1,783 1,289 760 167 3,999 131 476 3,294 3,901 7,900 1,877 11,209 3,524 4,724 3,137 705 12,090 535 1,139 3.490 BE SN 2,930 2,293 4,190 674 10,087 530 1,001 5,770 7/301 124363 992 3,034 4.593 16,275 10.537 2,1199 12,565 3402 19 22.538 2 3,880 27,548 Moreldrene Ate De mal wat dit een compositive member in "Manyanet of get me wlingen en de bank account for rent interesseerkager ** Scanned with CamScanner EXHIBIT I Grand Metropolitan, Guinnen, and Diagro Hinancial State Mini Sales Grand Mel Guinness CY 97 PF 8,045 6,978 FY 97 PF 12.985 10982 11.8 10. Operating costs Interest payable (net) Associates (net) Other Tanes Net Income Didends 153 5 (229) 249 CY 97 PF 4,33 3,584 81 71 (320) 255 370 FY 99 11,795 10,278 374 95 94 440 942 674 FY 98 12,029 10,659 360 112 478 721 879 835 89 (618) 532 654 FY98 FY99 See Note FY Operating profits 1,866 1,966 2.041 Cash interest paid (net) (258) (432) Taxes pald (603) (566) 1225 Cash from Operations 1,005 968 Dividends from investments 120 SB 6+ Tas Net capital sales experidilules (370) 1.368 121 Net divestitures (acquisitions) Cash from Investments 1118 (265) Management of Iquid resources (500) 2,195 Dividends paid (695) (702) Paid in capital from shares issued (repurchased) (2,662) (7,336) New debt 2,097 (716) Cash from Financing (1.860) (559) Total Change in Cash 263 Grand Met Guinness CY 97 PF CY 97 PF FY 97 PF FY 98 FY 99 FY00 Assets Cash and marketable securities 1,786 454 2,173 2.987 1,097 1.053 Accounts receivable 2,243 1,432 3,216 3,054 3,259 3.071 Inventory 995 1.909 2,374 2,236 2,202 2.139 Fixed assets 5,513 4,105 9,625 8,977 9,720 Total Assets 10,537 7,900 17,388 17,254 16,278 16,136 Liabilities and Owners' Equity Accounts payable 1,833 1,783 2,930 3,524 3,532 Short-term debt 1,730 1,289 2,293 4,724 3,905 3.050 Long-term debt 2,515 760 4,190 3,137 3,495 31 Other 463 167 674 705 753 Total Labilities 6,541 3,999 10,087 12.090 11,685 9093 Minority interests 416 131 530 535 567 Common stock 531 476 1,001 1,139 Retained earnings 992 990 3,049 3,294 Total Equity 5,770 3.490 3,034 3.721 3,996 3,901 7,301 Total Liabilities and Owners' Equity 5,164 4,593 5.255 10,537 7.900 17,388 17,254 16.278 Shares Outstanding 16,135 2,1196 Market Value of Equity 1,8770 3,880 3,402 12,5650 3,39 11,2096 27,548 22,538 20,144 he Grand Medical Author 1997 scal year water en proforma de cabelo e Gum. w you by an emerged before he was they made 199, led by Daterte Liquid Financials such could be held on or long terpenters of liter moved from compromet hus berkared deel the day "As of December 16, 17, the day for the second 3.25 Diepple 137 EXHIBIT 2 Diagro Segment Breakdown ( Millions) CY 96 PF FY 97 PF FY 98 FY 99 FY 00 Scane Dagen Rap Turnover Class of business Spirits and Wine Beer Packaged Food Restaurants Associates and other Total Geographical Area 5,830 2,262 3,784 877 687 13,440 5,692 2,259 3,755 879 400 12.985 5,327 2,176 3,654 869 3 12.029 4,929 2,234 3,757 875 0 11,795 4,971 2,146 3,812 941 0 11,870 Europe North America Asia Pacific Rest of World Associates and other Total Operating Profit Class of business Spirits and Wine 4,556 5,790 1,260 1,147 687 13,440 CY 96 PE 4,443 5,718 1,226 1,198 400 12,985 FY 97 PF 4,262 5,619 915 1,230 3 12,029 FY 98 4,230 5,656 777 1,132 0 11,795 FY 99 4,181 5,639 886 1,164 0 11,870 FY OO Beer 1,138 254 412 161 36 2,001 1,135 264 423 160 21 2,003 1,070 247 447 179 0 967 273 478 185 0 1,903 1,002 284 492 202 0 1,980 1,942 Packaged Food Restaurants Associates and other Total Geographical Area Europe North America Asia Pacific Rest of World Associates and other Total 543 913 251 258 36 2,001 552 901 261 268 21 2,003 534 938 174 297 1) 1,942 594 936 131 242 0 1,903 585 956 170 269 0 1,980 "Ananas undertaking in which the prophaletom equity rest and one which were significant influe. The poup's nesta de les of the den deilt, was included in the group balance sheet Jones who each party had to parte interest in particular risks and ads were sted for hy wchting the arrible share of the ats and liabilities and according the terms of the targement. "Other" includdisine operations 1996 1997 result reflect the points for Grand Metropolitan and Guinnew.combined 800 EXHIBIT 3 Diageo Stock Price and Scaled Financial Times Stock Exchange 100 Inder, January 1998-July 2000 Sur Duaren 200 Amy Price in me 3 www.home gan 1/1/00 XD V1198 11998 1/11 7/1/99 BAO DapoStack Price Scaled FTSE Index The FTSE 100 Index was aled to have the restarting value as Diageo's deck price on January 1, 1998 EXHIBIT 4 Selected Financial Date Companies with which are compared was of latent Annual Reporting Perid before October 2000 138 in local currency unless otherwise Beverage Coca- 118 Alcohol Beer Packaged Food Company Allied Pernod Anheuser Campbell General Diageo Domecq Ricard Busch Carlsberg Heineken Domicile Cola Pepsico Soup Heinz Kellogg Neste MIN U.K. UK France U.S. Employees (000) US US. Denmark Netherlands U.S. U.S. U.S. U.S. Switzerland 72 40 Mariet 24 18 37 37 22 11 47 15 231 capitalization (MM) 20,292 3,416 3,203 32,681 16,245 Market 15,184 143,969 51,289 11,534 11,813 12,493 112,032 11,634 capitalization (5 MM) 30,720 4,970 3,210 32,681 Enterprise 2,327 15,219 143,969 51,289 11,634 11,534 11,873 12.493 69,988 value (MM) 27,113 4.780 4,388 37,804 23,727 15,955 150,196 54,334 14,725 14,794 15,925 14,627 124,904 Enterprise value (5 MM 41,046 6,955 4,398 35,344 3,399 15,992 150,196 54,334 14,725 14,794 15,925 14,627 78,029 Price / Earrings rato 20.8x 10.8 13.7x 23.3% 14.OK 29.4% 59.2% 25.0 16.3 18.9x 13.3x 36.9% 23.7% Market / Book ratio 4.3 18.OK 1.6% 8.3x 1.6% 15.1% 7.5x 84.9 -39.9% 7.A 15.4% 4.6% Enterprise Value/EBIT 13.7% 11.4 11.8% 16.4% 20.0 31.3 18.8% 11.3 13.5x 11.8x 13.6x 15.8 Interest Coverage 5.OK 5.7x 10.4K 10.6% 4.1x 15.3% 15.5x 10.8% 7.3 7.8% 10.7x EBITDA/Total Debe 349 3596 40% 60% 40% 1599 84% 129% 48% 40% 401 64% 85% Book gearing 88% 36% 57% 42% 239 409 3191 964 110 72 77 Merkel gearing 25% 29% 279 14% 32% 595 4* 219 22 26% 15% 101 ROAS 1795 39% 24% 10% 2095 24% 22% 297 29% 19% 28% 18% Credit rating A+ A- NR A+ 888 M At A AA- A+ At M MA Beer 0.55 0.51 0.54 0.46 0.4 0.54 0.68 1.07 0.49 0.47 0.49 0.37 0.9 ROD 22.396 25.7% 22.3% 34.5% 11.6% 13.4% 27.1% 30.94 383.9% -986,2% 52.4% 39.7% 19.9% Dividends Paid (MM) 713 116 0 545 256 125 1.580 784 382 328 514 389 1,693 Capex (MM) 547 87 112 865 2,024 441 1,069 1,118 200 268 452 266 2,806 Exchange rate multiplier to 5 1.514 1.455 1.002 1. 0.143 1.002 1 1 1 0.625 7.4x 5.8% 34% 6% 594 159 1 1 Serwety value of colored EBIT is the globale define ENTON. DAS canine La regeluk weet plein de la ROA ishe Return Auels defined underland en lang weekly word med profondimples de comedord by bokep hot plegameplay wytwowy Theme Gallen EXHIBIT 4 Continued Conglomerate Restaurants Tricon Global McDonalds Restaurants U.S. U.S. 314 210 54,454 5,832 54,454 5,832 61,706 8,340 61,706 8,340 28.0 x 9.3 x 5.3 x -10.4 % 19.2 x 9.3 X 9.9 x 5696 519 129% 1296 30% 19% 329 M BB 0.81 0.42 20.496 -72.8% 265 0 1,868 470 Company Domicile Employees ('000) Market capitalization (MM) Market capitalization (5 MM) Enterprise value (MM) Enterprse value (5 MM) Price/Earnings ratio MarketBook ratio Enterprise Value / EBITU Interest coverage EBITDA/Total Deb Book gearing' Market gearing' ROAD Credit rating" Betal ROL Dividends paid (MM) Capex (MM) Exchange rate multiplier to s Colgate- Palmolive U.S. 37 37,626 37,626 40,416 40,416 40.1 x 20.5 x 25.8 x 85x 68% 6096 796 2696 1.29 47.296 345 373 1 Consumer Philip Gillette Morris U.S. U.S. 40 137 43,865 53,786 43.865 53,786 48,594 68,254 48,594 68,254 34.8 x 7.0 x 12.8 x 3.5 x 23.1 x 5.0 x 18.6 x 14.1 x 53% 107% 589 49% 10% 21% 21% 25% A 1.03 0.34 33.8% 48.796 642 4,393 932 1,749 1 Procter & Gamble U.S. 110 74,761 74,761 86,887 86,887 21.1 x 6.1 x 12.8 x 12.4 x 74% SOW 14 26% 0.37 28.8% 1,681 3,018 Seagram U.S. 34 25,352 25,352 33,229 33,229 1,690.1 x 2.1 x 47.9 x 2.4 x 2296 39% 24% 5% BB8- 1.02 1.0% 287 607 1 5.9 x Unilever U.K. 255 13,262 21,374 16,239 26,172 7.3 x 2.7 x 5.7 x 12.2 x 121% 3896 18% 21% A+ 0.77 45.2% 820 865 1.612 Nice mutand Global Venta a un fut pe valeur arm and linem Teigs I fee and Tegen define ENTO Lambret lange Alpen Aliandas lingorm plusern drinked by the burde vahel of capital dhe term plan media place del Mela med en mytem plurm haded by de los polo market value of apy, ROA NG PA, food IMENTDA Aantal wher, un calend www me the eglume 2 keer plyThe nuky Cyruchane role INNTICI EXHIBIT S Selected bats en Hond Market for .rar Notes. Cette 1.3000 Interest Interest Rate Rate (Pounds) (Dollars) 5.56 Rating U.K. Government U.S. Government Median Interest Coverage Issuing Firms with Rating Average Monthly Issuance (5 billion) Minimum Monthly Issuance (5 Billion) Maxim Monthly Iswane 3.64 5.83% 6.13 6.76 30.07 0.53 11.08 6.37% 6.81% 11.37 13% 3.25 0.00 23.63 6.76% 7.15% 8.34 25%. 647 0.69 30 65 7.16% 7.57% 4.94 22% 1.76 0.09 8.73 Noer Medly rene dereceded berec Jury, and the interne denominated the US The was all the US winner forevered to be higher ed imagem de arbetet AA BBS EXHIBIT 6 Diageo Liability Structure, June 30, 2000 See the Annual Report 3500 6000 XXO 2010 4000 2000 Million Penting Million Pounds outstanding 3000 1.RO 2000 TO 500 1000 2-5 0 0 1-2 5+ Dollar Euro Sterling Maturity. years Note. The deht outstanding included bank loans and overdrafts, Esther borrowings, financial leases, and other long term oblastim Liability currency EXHIBIT 7A Industry Returns on Assets (EBITDA/Assets), with Diageo Mix of Businesses Source the Volatility Firms In Average Max Median Min of Industry Industry Composite ROA ROA ROA ROA ROA Spirits 6 16.9% 24.296 16.796 12.696 2.3% Beer 1 20.6% 27.2% 21.2% 14.396 3.09 Food 19.8% 25.8% 19.896 12.596 3.196 21.096 Fast Food 29.6% 19.996 14.19 3.69 19.79 26.7% 19 596 16.396 Weighted Average 1.99 17.796 24.9% 17.2% 15.1% Weighted Avg (Beverages) 1.9 of Volt "The Weiche Avecil y pro by die weg ofte her "The Wege Aug leverageste rights that aclude the bag and Resep "The RA was called for the industry for each year in the The way of RA Calculated by the art orgel volatility anladencah Aware Scanned with CamScanner EXHIBIT 2 IngreSegment Madona 1 Millions) 4,971 875 12.985 Il 137 Turnover CY 96 PF FY 97 PF FY 98 FY 99 FY OO Class of business Spirits and Wine 5,830 Beer 5,692 5,327 4,929 2,262 2,259 2,176 Packaged Food 2,234 2,146 3,784 Restaurants 3,755 3,654 3,757 3,812 877 879 869 941 Associates and other 687 400 3 0 0 Total 13.440 Geographical Area 12,029 11,795 11,870 Europe 4,556 4,443 4,262 4,230 4,181 North America 5,790 5,718 5,619 5,656 5,639 Asia Pacific 1,260 1,226 915 777 886 Rest of World 1,147 1,198 1,230 1,132 1,164 Associates and other 687 400 0 0 Total 13,440 12.985 12,029 11,795 11,870 Operating Profit CY 96 PF FY 97 PF FY 98 FY 99 FY00 Class of business Spirits and Wine 1,138 1,135 1,070 1,002 Beer 254 264 247 273 284 Packaged Food 412 423 478 492 Restaurants 161 160 179 185 202 Associates and other 36 21 (0) 0 0 Total 2,001 2,003 1,942 1903 1.980 Geographical Area Europe 543 552 534 594 585 North America 913 938 936 956 Asia Pacific 251 261 174 131 Rest of World 258 268 297 269 Associates and other 36 21 (0) 0 0 Total 2,001 2,003 1,942 1,903 1,980 ding is wichtigroup halagay. The prepare the other than it is lives in the prepletenes hanya mendaftly wg the weathe was de empreendedores 19 Wres reflect the professed Meng diesel 200 967 447 901 170 242 EXHIBIT 3 Dlagro Stock Price and Sealed Paancial Times Stock Exchange 1 Indies 700 1991-July 2000 600 mm 00 1100 1998 300 199 TV 1100 Dlugo Stack Price Sated FTSE Index Me: The FTSE 100 lades essed to have the realm Diyet's creencary 1, 1998 EXHIBIT 1 Grand Metropolitan. FY 98 12,029 10,659 FY 99 11,795 Grand Met CY 97 PF 8,045 6,978 153 5 (229) Guinness CY 97 PF 4,539 3,584 81 71 (320) 255 370 360 Sales Operating costs Interest payable (net) Associates (net) Other Taxes Net Income Dividends 10,278 0.013 FY 97 PF 12,985 10,982 268 89 (618) 532 674 654 324 95 94 112 478 721 879 835 249 441 942 674 FY99 1,966 See Note FY98 1,866 (258) (603) 1.005 Operating profits Cash interest paid (net) Taxes paid cash from Operations Dividends from investments Net capital sales (expenditures) Net divestitures (acquisitions) Cash from Investments Management of liquid resources Dividends paid Paid in capital from shares issued Crepurchased) New debt Cash from Financing Total Change in Cash (370) 1,368 1,118 (600) (695) (566) 968 58 (444) 121 (265) 2,195 (702) (2,662) 2,097 0.360) 263 (1,336) (716) (5590 1 Grand Met CY 97 PF Guinness CY 97 PF FY 97 PF FY 98 FY 99 LAN 1,786 2,243 995 5,513 10,337 1,432 1,909 $105 2,173 3,216 2,374 9,625 17,368 2,987 3,054 2,236 8,977 17,254 1,097 3,259 2,202 9.220 7,900 Assets Cash and marketable securities Accounts receivable Inventory Fixed assets Total Assets Liabilities and Owners' Equity Accounts payable Short-term debe Long-term debe Other Total Liabilities Minority interests Common stock Retained earnings Total Equity Total Liabilities and Owners Equity Shares Outstanding Market Value of Equity LIN IR 1,833 1,730 2,515 463 6,541 416 531 3.049 3,532 3,905 3,495 253 11,685 1,783 1,289 760 167 3,999 131 476 3,294 3,901 7,900 1,877 11,209 3,524 4,724 3,137 705 12,090 535 1,139 3.490 BE SN 2,930 2,293 4,190 674 10,087 530 1,001 5,770 7/301 124363 992 3,034 4.593 16,275 10.537 2,1199 12,565 3402 19 22.538 2 3,880 27,548 Moreldrene Ate De mal wat dit een compositive member in "Manyanet of get me wlingen en de bank account for rent interesseerkager ** Scanned with CamScanner EXHIBIT I Grand Metropolitan, Guinnen, and Diagro Hinancial State Mini Sales Grand Mel Guinness CY 97 PF 8,045 6,978 FY 97 PF 12.985 10982 11.8 10. Operating costs Interest payable (net) Associates (net) Other Tanes Net Income Didends 153 5 (229) 249 CY 97 PF 4,33 3,584 81 71 (320) 255 370 FY 99 11,795 10,278 374 95 94 440 942 674 FY 98 12,029 10,659 360 112 478 721 879 835 89 (618) 532 654 FY98 FY99 See Note FY Operating profits 1,866 1,966 2.041 Cash interest paid (net) (258) (432) Taxes pald (603) (566) 1225 Cash from Operations 1,005 968 Dividends from investments 120 SB 6+ Tas Net capital sales experidilules (370) 1.368 121 Net divestitures (acquisitions) Cash from Investments 1118 (265) Management of Iquid resources (500) 2,195 Dividends paid (695) (702) Paid in capital from shares issued (repurchased) (2,662) (7,336) New debt 2,097 (716) Cash from Financing (1.860) (559) Total Change in Cash 263 Grand Met Guinness CY 97 PF CY 97 PF FY 97 PF FY 98 FY 99 FY00 Assets Cash and marketable securities 1,786 454 2,173 2.987 1,097 1.053 Accounts receivable 2,243 1,432 3,216 3,054 3,259 3.071 Inventory 995 1.909 2,374 2,236 2,202 2.139 Fixed assets 5,513 4,105 9,625 8,977 9,720 Total Assets 10,537 7,900 17,388 17,254 16,278 16,136 Liabilities and Owners' Equity Accounts payable 1,833 1,783 2,930 3,524 3,532 Short-term debt 1,730 1,289 2,293 4,724 3,905 3.050 Long-term debt 2,515 760 4,190 3,137 3,495 31 Other 463 167 674 705 753 Total Labilities 6,541 3,999 10,087 12.090 11,685 9093 Minority interests 416 131 530 535 567 Common stock 531 476 1,001 1,139 Retained earnings 992 990 3,049 3,294 Total Equity 5,770 3.490 3,034 3.721 3,996 3,901 7,301 Total Liabilities and Owners' Equity 5,164 4,593 5.255 10,537 7.900 17,388 17,254 16.278 Shares Outstanding 16,135 2,1196 Market Value of Equity 1,8770 3,880 3,402 12,5650 3,39 11,2096 27,548 22,538 20,144 he Grand Medical Author 1997 scal year water en proforma de cabelo e Gum. w you by an emerged before he was they made 199, led by Daterte Liquid Financials such could be held on or long terpenters of liter moved from compromet hus berkared deel the day "As of December 16, 17, the day for the second 3.25 Diepple 137 EXHIBIT 2 Diagro Segment Breakdown ( Millions) CY 96 PF FY 97 PF FY 98 FY 99 FY 00 Scane Dagen Rap Turnover Class of business Spirits and Wine Beer Packaged Food Restaurants Associates and other Total Geographical Area 5,830 2,262 3,784 877 687 13,440 5,692 2,259 3,755 879 400 12.985 5,327 2,176 3,654 869 3 12.029 4,929 2,234 3,757 875 0 11,795 4,971 2,146 3,812 941 0 11,870 Europe North America Asia Pacific Rest of World Associates and other Total Operating Profit Class of business Spirits and Wine 4,556 5,790 1,260 1,147 687 13,440 CY 96 PE 4,443 5,718 1,226 1,198 400 12,985 FY 97 PF 4,262 5,619 915 1,230 3 12,029 FY 98 4,230 5,656 777 1,132 0 11,795 FY 99 4,181 5,639 886 1,164 0 11,870 FY OO Beer 1,138 254 412 161 36 2,001 1,135 264 423 160 21 2,003 1,070 247 447 179 0 967 273 478 185 0 1,903 1,002 284 492 202 0 1,980 1,942 Packaged Food Restaurants Associates and other Total Geographical Area Europe North America Asia Pacific Rest of World Associates and other Total 543 913 251 258 36 2,001 552 901 261 268 21 2,003 534 938 174 297 1) 1,942 594 936 131 242 0 1,903 585 956 170 269 0 1,980 "Ananas undertaking in which the prophaletom equity rest and one which were significant influe. The poup's nesta de les of the den deilt, was included in the group balance sheet Jones who each party had to parte interest in particular risks and ads were sted for hy wchting the arrible share of the ats and liabilities and according the terms of the targement. "Other" includdisine operations 1996 1997 result reflect the points for Grand Metropolitan and Guinnew.combined 800 EXHIBIT 3 Diageo Stock Price and Scaled Financial Times Stock Exchange 100 Inder, January 1998-July 2000 Sur Duaren 200 Amy Price in me 3 www.home gan 1/1/00 XD V1198 11998 1/11 7/1/99 BAO DapoStack Price Scaled FTSE Index The FTSE 100 Index was aled to have the restarting value as Diageo's deck price on January 1, 1998 EXHIBIT 4 Selected Financial Date Companies with which are compared was of latent Annual Reporting Perid before October 2000 138 in local currency unless otherwise Beverage Coca- 118 Alcohol Beer Packaged Food Company Allied Pernod Anheuser Campbell General Diageo Domecq Ricard Busch Carlsberg Heineken Domicile Cola Pepsico Soup Heinz Kellogg Neste MIN U.K. UK France U.S. Employees (000) US US. Denmark Netherlands U.S. U.S. U.S. U.S. Switzerland 72 40 Mariet 24 18 37 37 22 11 47 15 231 capitalization (MM) 20,292 3,416 3,203 32,681 16,245 Market 15,184 143,969 51,289 11,534 11,813 12,493 112,032 11,634 capitalization (5 MM) 30,720 4,970 3,210 32,681 Enterprise 2,327 15,219 143,969 51,289 11,634 11,534 11,873 12.493 69,988 value (MM) 27,113 4.780 4,388 37,804 23,727 15,955 150,196 54,334 14,725 14,794 15,925 14,627 124,904 Enterprise value (5 MM 41,046 6,955 4,398 35,344 3,399 15,992 150,196 54,334 14,725 14,794 15,925 14,627 78,029 Price / Earrings rato 20.8x 10.8 13.7x 23.3% 14.OK 29.4% 59.2% 25.0 16.3 18.9x 13.3x 36.9% 23.7% Market / Book ratio 4.3 18.OK 1.6% 8.3x 1.6% 15.1% 7.5x 84.9 -39.9% 7.A 15.4% 4.6% Enterprise Value/EBIT 13.7% 11.4 11.8% 16.4% 20.0 31.3 18.8% 11.3 13.5x 11.8x 13.6x 15.8 Interest Coverage 5.OK 5.7x 10.4K 10.6% 4.1x 15.3% 15.5x 10.8% 7.3 7.8% 10.7x EBITDA/Total Debe 349 3596 40% 60% 40% 1599 84% 129% 48% 40% 401 64% 85% Book gearing 88% 36% 57% 42% 239 409 3191 964 110 72 77 Merkel gearing 25% 29% 279 14% 32% 595 4* 219 22 26% 15% 101 ROAS 1795 39% 24% 10% 2095 24% 22% 297 29% 19% 28% 18% Credit rating A+ A- NR A+ 888 M At A AA- A+ At M MA Beer 0.55 0.51 0.54 0.46 0.4 0.54 0.68 1.07 0.49 0.47 0.49 0.37 0.9 ROD 22.396 25.7% 22.3% 34.5% 11.6% 13.4% 27.1% 30.94 383.9% -986,2% 52.4% 39.7% 19.9% Dividends Paid (MM) 713 116 0 545 256 125 1.580 784 382 328 514 389 1,693 Capex (MM) 547 87 112 865 2,024 441 1,069 1,118 200 268 452 266 2,806 Exchange rate multiplier to 5 1.514 1.455 1.002 1. 0.143 1.002 1 1 1 0.625 7.4x 5.8% 34% 6% 594 159 1 1 Serwety value of colored EBIT is the globale define ENTON. DAS canine La regeluk weet plein de la ROA ishe Return Auels defined underland en lang weekly word med profondimples de comedord by bokep hot plegameplay wytwowy Theme Gallen EXHIBIT 4 Continued Conglomerate Restaurants Tricon Global McDonalds Restaurants U.S. U.S. 314 210 54,454 5,832 54,454 5,832 61,706 8,340 61,706 8,340 28.0 x 9.3 x 5.3 x -10.4 % 19.2 x 9.3 X 9.9 x 5696 519 129% 1296 30% 19% 329 M BB 0.81 0.42 20.496 -72.8% 265 0 1,868 470 Company Domicile Employees ('000) Market capitalization (MM) Market capitalization (5 MM) Enterprise value (MM) Enterprse value (5 MM) Price/Earnings ratio MarketBook ratio Enterprise Value / EBITU Interest coverage EBITDA/Total Deb Book gearing' Market gearing' ROAD Credit rating" Betal ROL Dividends paid (MM) Capex (MM) Exchange rate multiplier to s Colgate- Palmolive U.S. 37 37,626 37,626 40,416 40,416 40.1 x 20.5 x 25.8 x 85x 68% 6096 796 2696 1.29 47.296 345 373 1 Consumer Philip Gillette Morris U.S. U.S. 40 137 43,865 53,786 43.865 53,786 48,594 68,254 48,594 68,254 34.8 x 7.0 x 12.8 x 3.5 x 23.1 x 5.0 x 18.6 x 14.1 x 53% 107% 589 49% 10% 21% 21% 25% A 1.03 0.34 33.8% 48.796 642 4,393 932 1,749 1 Procter & Gamble U.S. 110 74,761 74,761 86,887 86,887 21.1 x 6.1 x 12.8 x 12.4 x 74% SOW 14 26% 0.37 28.8% 1,681 3,018 Seagram U.S. 34 25,352 25,352 33,229 33,229 1,690.1 x 2.1 x 47.9 x 2.4 x 2296 39% 24% 5% BB8- 1.02 1.0% 287 607 1 5.9 x Unilever U.K. 255 13,262 21,374 16,239 26,172 7.3 x 2.7 x 5.7 x 12.2 x 121% 3896 18% 21% A+ 0.77 45.2% 820 865 1.612 Nice mutand Global Venta a un fut pe valeur arm and linem Teigs I fee and Tegen define ENTO Lambret lange Alpen Aliandas lingorm plusern drinked by the burde vahel of capital dhe term plan media place del Mela med en mytem plurm haded by de los polo market value of apy, ROA NG PA, food IMENTDA Aantal wher, un calend www me the eglume 2 keer plyThe nuky Cyruchane role INNTICI EXHIBIT S Selected bats en Hond Market for .rar Notes. Cette 1.3000 Interest Interest Rate Rate (Pounds) (Dollars) 5.56 Rating U.K. Government U.S. Government Median Interest Coverage Issuing Firms with Rating Average Monthly Issuance (5 billion) Minimum Monthly Issuance (5 Billion) Maxim Monthly Iswane 3.64 5.83% 6.13 6.76 30.07 0.53 11.08 6.37% 6.81% 11.37 13% 3.25 0.00 23.63 6.76% 7.15% 8.34 25%. 647 0.69 30 65 7.16% 7.57% 4.94 22% 1.76 0.09 8.73 Noer Medly rene dereceded berec Jury, and the interne denominated the US The was all the US winner forevered to be higher ed imagem de arbetet AA BBS EXHIBIT 6 Diageo Liability Structure, June 30, 2000 See the Annual Report 3500 6000 XXO 2010 4000 2000 Million Penting Million Pounds outstanding 3000 1.RO 2000 TO 500 1000 2-5 0 0 1-2 5+ Dollar Euro Sterling Maturity. years Note. The deht outstanding included bank loans and overdrafts, Esther borrowings, financial leases, and other long term oblastim Liability currency EXHIBIT 7A Industry Returns on Assets (EBITDA/Assets), with Diageo Mix of Businesses Source the Volatility Firms In Average Max Median Min of Industry Industry Composite ROA ROA ROA ROA ROA Spirits 6 16.9% 24.296 16.796 12.696 2.3% Beer 1 20.6% 27.2% 21.2% 14.396 3.09 Food 19.8% 25.8% 19.896 12.596 3.196 21.096 Fast Food 29.6% 19.996 14.19 3.69 19.79 26.7% 19 596 16.396 Weighted Average 1.99 17.796 24.9% 17.2% 15.1% Weighted Avg (Beverages) 1.9 of Volt "The Weiche Avecil y pro by die weg ofte her "The Wege Aug leverageste rights that aclude the bag and Resep "The RA was called for the industry for each year in the The way of RA Calculated by the art orgel volatility anladencah Aware Scanned with CamScanner Step by Step Solution
There are 3 Steps involved in it
Step: 1

Get Instant Access to Expert-Tailored Solutions
See step-by-step solutions with expert insights and AI powered tools for academic success
Step: 2

Step: 3

Ace Your Homework with AI
Get the answers you need in no time with our AI-driven, step-by-step assistance
Get Started


