Answered step by step
Verified Expert Solution
Question
1 Approved Answer
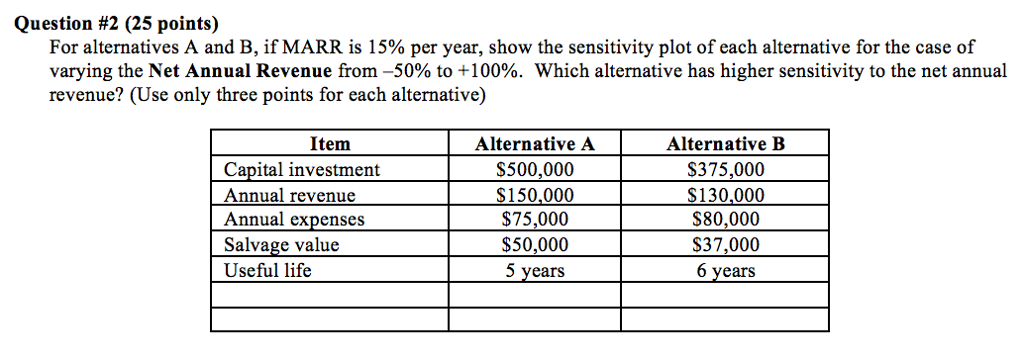
Show complete steps and work PLEASE Question #2 (25 points) For alternatives A and B, if MARR is 15% per year, show the sensitivity plot

Show complete steps and work PLEASE
Question #2 (25 points) For alternatives A and B, if MARR is 15% per year, show the sensitivity plot of each alternative for the case of varying the Net Annual Revenue from-50% to +100%, which alternative has higher sensitivity to the net annual revenue? (Use only three points for each alternative) Item Alternative A S500,000 S150,000 $75,000 $50,000 5 years Alternative B Capital investment Annual revenue Annual expenses Salvage value Useful life 5,000 S130,000 $80,000 S37,000 6 yearsStep by Step Solution
There are 3 Steps involved in it
Step: 1

Get Instant Access to Expert-Tailored Solutions
See step-by-step solutions with expert insights and AI powered tools for academic success
Step: 2

Step: 3

Ace Your Homework with AI
Get the answers you need in no time with our AI-driven, step-by-step assistance
Get Started


