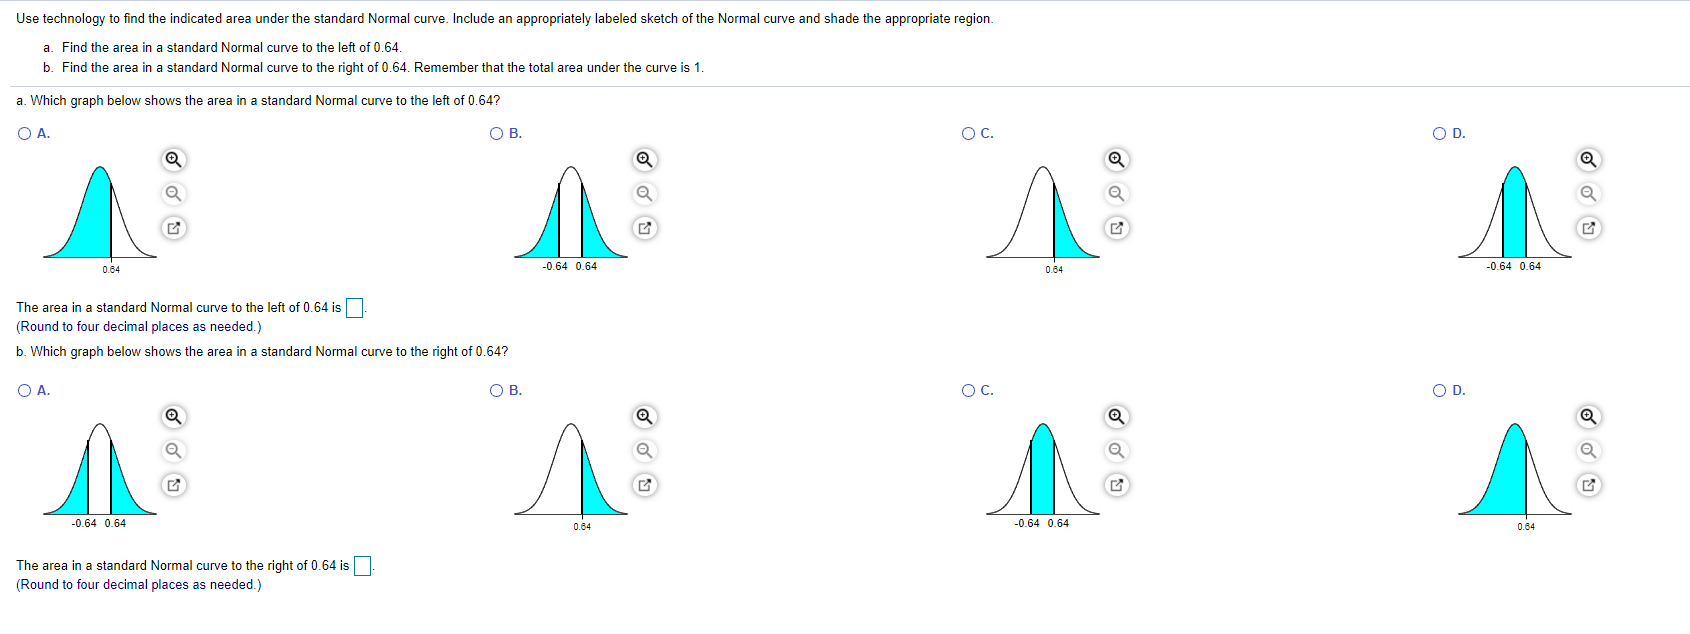
find the answer
Use technology to find the indicated area under the standard Normal curve. Include an appropriately labeled sketch of the Normal curve and shade the appropriate region. a. Find the area in a standard Normal curve to the left of 0.64. b. Find the area in a standard Normal curve to the right of 0.64. Remember that the total area under the curve is 1. a. Which graph below shows the area in a standard Normal curve to the left of 0.64? O A. OB. OC. OD. 0.64 -0.64 0.64 0.64 -0.64 0.64 The area in a standard Normal curve to the left of 0.64 is]. (Round to four decimal places as needed. b. Which graph below shows the area in a standard Normal curve to the right of 0.64? O A. OB. O c. OD. -0.64 0.64 0.8 -0.64 0.64 0.6 The area in a standard Normal curve to the right of 0.64 is (Round to four decimal places as needed.)Data were collected on the total energy consumption per capita (in million BTUs) for a number of cities in Country X. A summary of the data is shown in the table. Column Min Q1 Median Q3 Max Total BTU 11.7 49.8 94.3 153.7 639.2 a. What percentage of Country X consumed fewer than 49.8 million BTUs per capita? b. What percentage of Country X consumed fewer than 153.7 million BTUs per capita? c. Complete this sentence: 50% of Country X consumed more than _ million BTUs per capita. d. Find and interpret in context the IQR for this data set. O A. a. 25%, b. 75%, c. 94.3, d. IQR=103.9. The range of the middle 50% of the sorted data is 103.9 million BTUs. O B. a. 25%, b. 50%, c. 94.3, d. IQR =103.9. The range of the middle 50% of the sorted data is 103.9 million BTUs. O C. a. 25%, b. 50%, c. 94.3, d. IQR =101.8. The range of the middle 50% of the sorted data is 101.8 million BTUs. O D. a. 50%, b. 75%, c. 94.3, d. IQR =101.8. The range of the middle 50% of the sorted data is 101.8 million BTUs