Answered step by step
Verified Expert Solution
Link Copied!

Question

1 Approved Answer

Find the mean of the data summarized in the given frequency distribution. Compare the computed mean to the actual mean of 57.5 degrees. Low Temperature
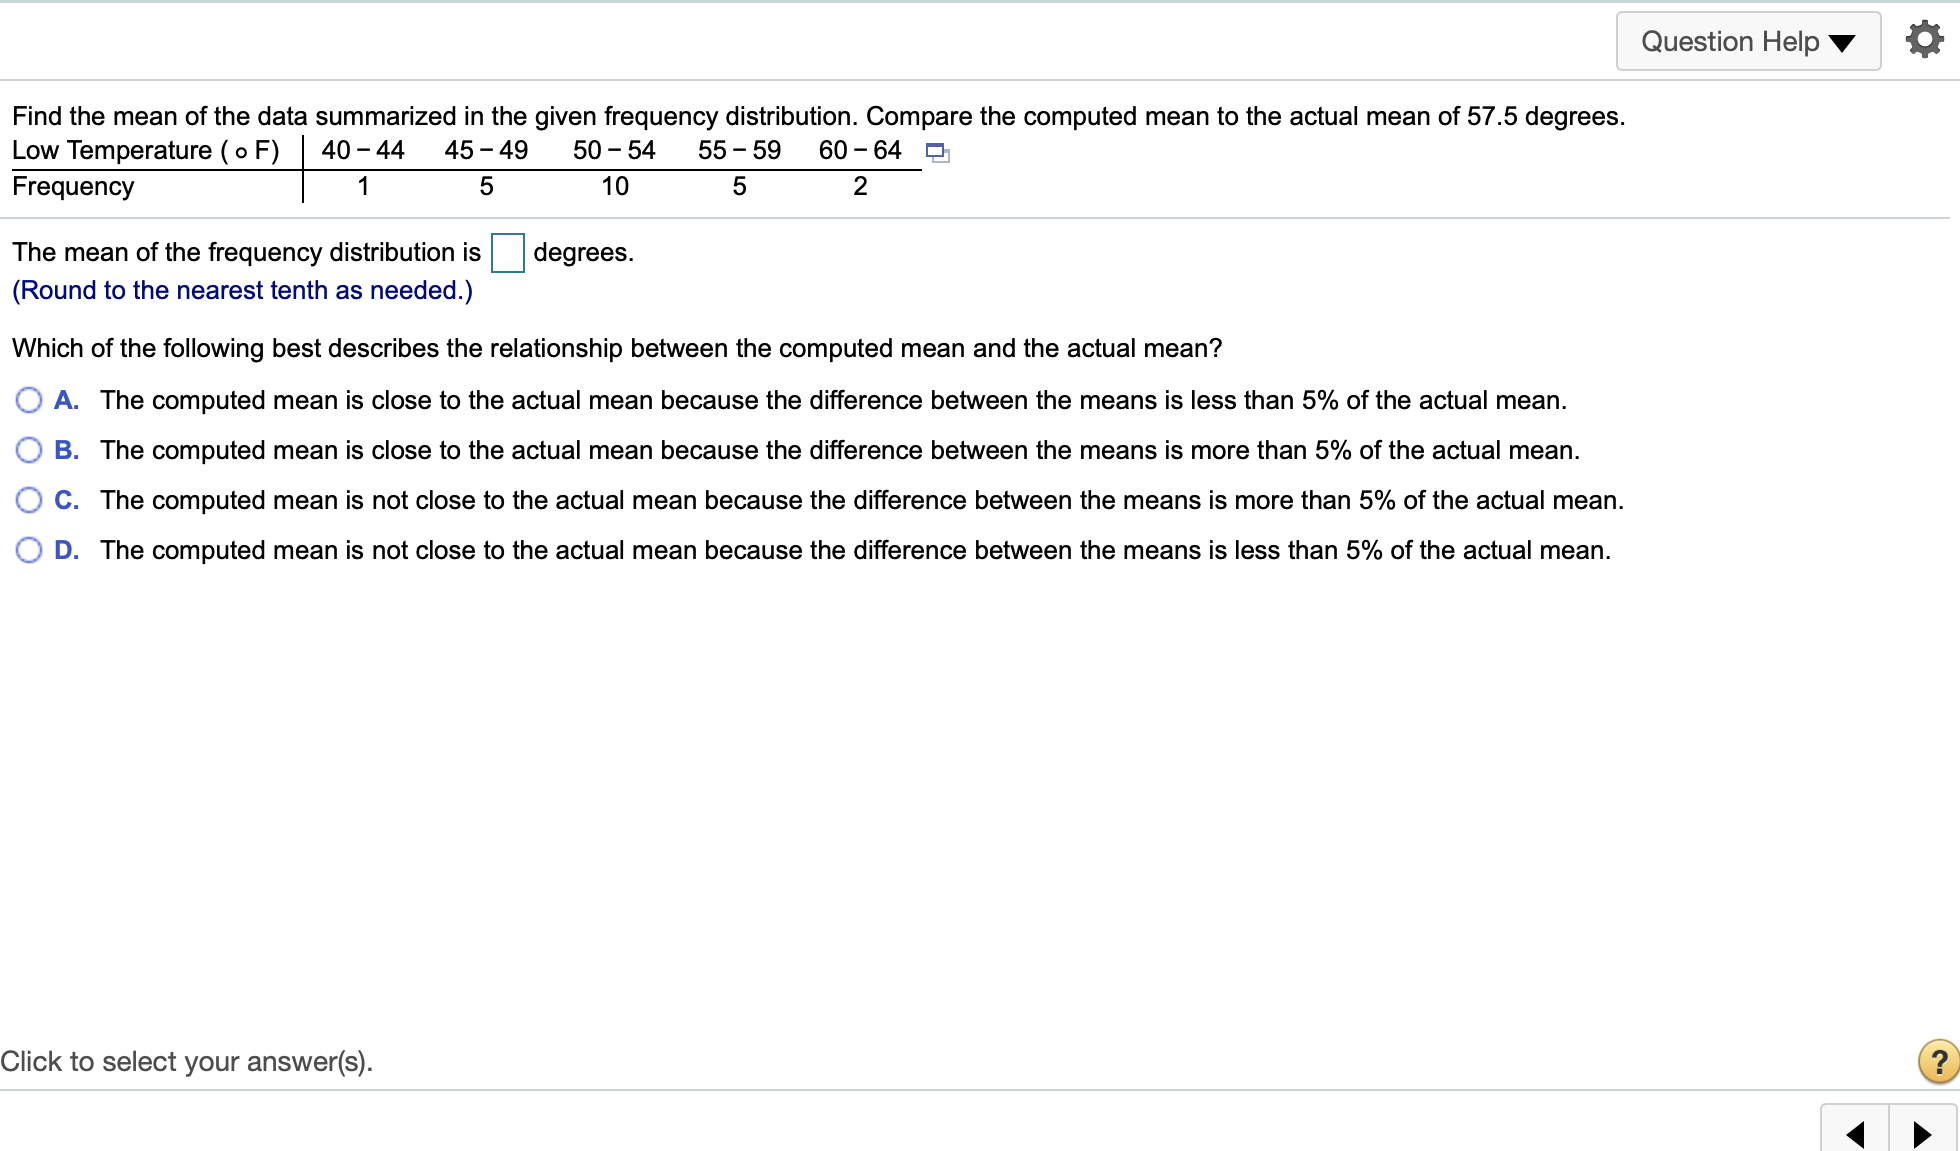
image text in transcribed
Find the mean of the data summarized in the given frequency distribution. Compare the computed mean to the actual mean of 57.5 degrees. Low Temperature ( o F) 40 - 44 45 - 49 50 - 54 55 - 59 60 - 64 Q Frequency 1 5 10 5 2 The mean of the frequency distribution is El degrees. (Round to the nearest tenth as needed.) Which of the following best describes the relationship between the computed mean and the actual mean? 0 A. The computed mean is close to the actual mean because the difference between the means is less than 5% of the actual mean. 0 B. The computed mean is close to the actual mean because the difference between the means is more than 5% of the actual mean. 0 C. The computed mean is not close to the actual mean because the difference between the means is more than 5% of the actual mean. 0 D. The computed mean is not close to the actual mean because the difference between the means is less than 5% of the actual mean. Click to select your answer(s). Question Help Y

Step by Step Solution

There are 3 Steps involved in it

Step: 1

blur-text-image

Get Instant Access to Expert-Tailored Solutions

See step-by-step solutions with expert insights and AI powered tools for academic success

Step: 2

blur-text-image

Step: 3

blur-text-image

Ace Your Homework with AI

Get the answers you need in no time with our AI-driven, step-by-step assistance

Get Started

Recommended Textbook for

Elementary Algebra

Authors: Charles P McKeague

3rd Edition

1483263843, 9781483263847

More Books

Students also viewed these Mathematics questions

Question

What is post processing in computer-assisted part programming?

Answered: 1 week ago

Question

5. Have you stressed the topics relevance to your audience?

Answered: 1 week ago