

Answered step by step
Verified Expert Solution
Question
1 Approved Answer
find the missing numbers in the following chart please begin{tabular}{|c|c|c|c|} hline & 2023 & 2024 & 2025 hline Gross Sales & $290,000 & &
find the missing numbers in the following chart please 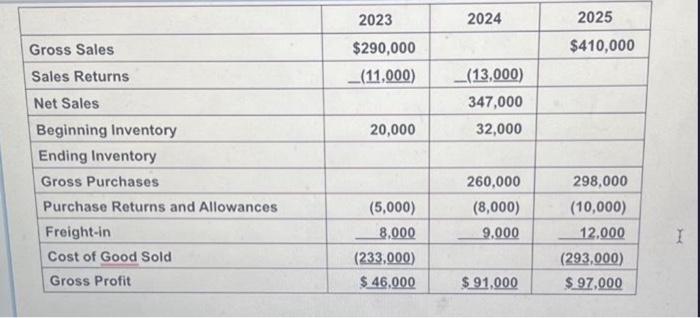
\begin{tabular}{|c|c|c|c|} \hline & 2023 & 2024 & 2025 \\ \hline Gross Sales & $290,000 & & $410,000 \\ \hline Sales Returns & (11,000) & (13,000) & \\ \hline Net Sales & & 347,000 & 4 \\ \hline Beginning Inventory & 20,000 & 32,000 & \\ \hline \multicolumn{4}{|l|}{ Ending Inventory } \\ \hline Gross Purchases & & 260,000 & 298,000 \\ \hline Purchase Returns and Allowances & (5,000) & (8,000) & (10,000) \\ \hline Freight-in & 8,000 & 9.000 & 12,000 \\ \hline Cost of Good Sold & (233,000) & & (293,000) \\ \hline Gross Profit & $46,000 & $91,000 & $97,000 \\ \hline \end{tabular} Step by Step Solution
There are 3 Steps involved in it
Step: 1

Get Instant Access to Expert-Tailored Solutions
See step-by-step solutions with expert insights and AI powered tools for academic success
Step: 2

Step: 3
Ace Your Homework with AI
Get the answers you need in no time with our AI-driven, step-by-step assistance
Get Started
Beating The Finacial Futures Market 2023 Deluxe Edition Almanac
Authors: Art Collins
1st Edition
979-8375310534