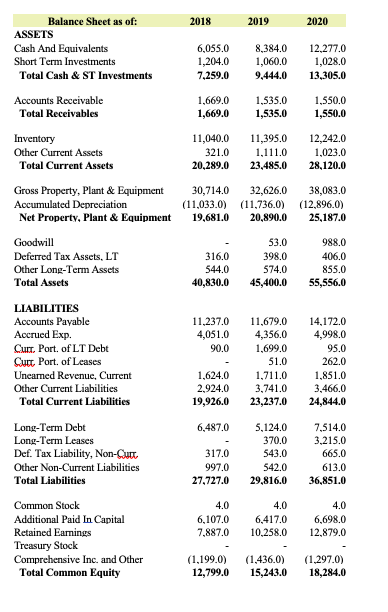
Find the net working capital for 2018 and for 2020 with steps


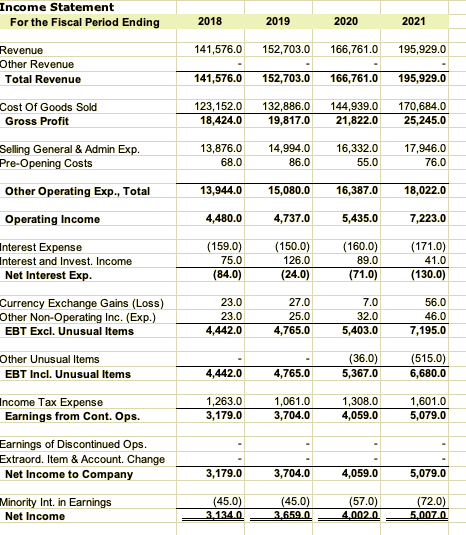
2018 2019 2020 6,055.0 1,204.0 7,259.0 8,384.0 1,060.0 9,444.0 12.277.0 1,028.0 13,305.0 1,669.0 1,669.0 1,535.0 1,535.0 1,550.0 1,550.0 11,040.0 321.0 20.289.0 11,395.0 1,111.0 23,485.0 12,242.0 1,023.0 28.120.0 30,714.0 32,626.0 (11,033.0) (11,736.0) 19,681.0 20,890.0 38,083.0 (12,896.0) 25,187.0 Balance Sheet as of: ASSETS Cash And Equivalents Short Term Investments Total Cash & ST Investments Accounts Receivable Total Receivables Inventory Other Current Assets Total Current Assets Gross Property, Plant & Equipment Accumulated Depreciation Net Property, Plant & Equipment Goodwill Deferred Tax Assets.LT Other Long-Term Assets Total Assets LIABILITIES Accounts Payable Accrued Exp. Curr. Port of LT Debt Curr, Port of Leases Unearned Revenue, Current Other Current Liabilities Total Current Liabilities Long-Term Debt Long-Term Leases Def. Tax Liability, Non-Curt Other Non-Current Liabilities Total Liabilities 316.0 544.0 40,830.0 53.0 398,0 574.0 45,400.0 988.0 406.0 855.0 55,556.0 11,237.0 4,051.0 90.0 11,679.0 4,356.0 1,699.0 51.0 1.711.0 3,741.0 23,237.0 14,172.0 4,998.0 95.0 262.0 1,851.0 3,466.0 24,844.0 1,624.0 2,924.0 19,926.0 6,487.0 317.0 997.0 27,727.0 5,124.0 370.0 543.0 542.0 29,816.0 7.514.0 3.215.0 665.0 613.0 36,851.0 4.0 6,107.0 7,887.0 4.0 6,417.0 10,258,0 4.0 6,698.0 12,879.0 Common Stock Additional Paid In Capital Retained Earnings Treasury Stock Comprehensive Inc. and Other Total Common Equity (1.199.0) 12,799.0 (1,436.0) 15,243.0 (1.297.0) 18,284.0 Income Statement For the Fiscal Period Ending 2018 2019 2020 2021 141,576.0 152,703.0 166,761.0 195,929.0 Revenue Other Revenue Total Revenue 141,576.0 152,703.0 166,761.0 195,929.0 123,152.0 18,424.0 132,886.0 19,817.0 144,939.0 21,822.0 170,684.0 25,245.0 Cost Of Goods Sold Gross Profit Selling General & Admin Exp. Pre-Opening Costs Other Operating Exp., Total Operating Income 13,876.0 68.0 14,994.0 86.0 16,332.0 55.0 17,946.0 76.0 13,944.0 15,080.0 16,387.0 18,022.0 4,480.0 4,737.0 5,435.0 7,223.0 (159.0) 75.0 (84.0) (150.0) 126.0 (24.0) (160.0) 89.0 (71.0) (171.0) 41.0 (130.0) 23.0 23.0 4,442.0 27.0 25.0 4,765.0 7.0 32.0 5,403.0 56.0 46.0 7,195.0 Interest Expense Interest and Invest. Income Net Interest Exp. Currency Exchange Gains (Loss) Other Non-Operating Inc. (Exp.) EBT Excl. Unusual Items Other Unusual Items EBT Incl. Unusual Items Income Tax Expense Earnings from Cont. Ops. Earnings of Discontinued Ops. Extraord. Item & Account Change Net Income to Company (36.0) 5,367.0 (515.0) 6,680.0 4,442.0 4,765.0 1,263.0 3,179.0 1,061.0 3,704.0 1,308.0 4,059.0 1,601.0 5,079.0 3,179.0 3,704.0 4,059.0 5,079.0 Minority Int. in Earnings Net Income (45.0) 3.134.0 (45.0) 3.659.0 (57.0) 4.002.0 (72.0) 5.007.0 Minority Interest 304.0 341.0 421.0 Total Equity 13,103.0 15,584.0 18,705.0 Total Liabilities And Equity 40,830.0 45,400.0 55,556.0


