

Answered step by step
Verified Expert Solution
Question
1 Approved Answer
Finding a center locations In lab, we learned how to plot a map and use ginput to select several points on the map. In lecture,
Finding a center locations
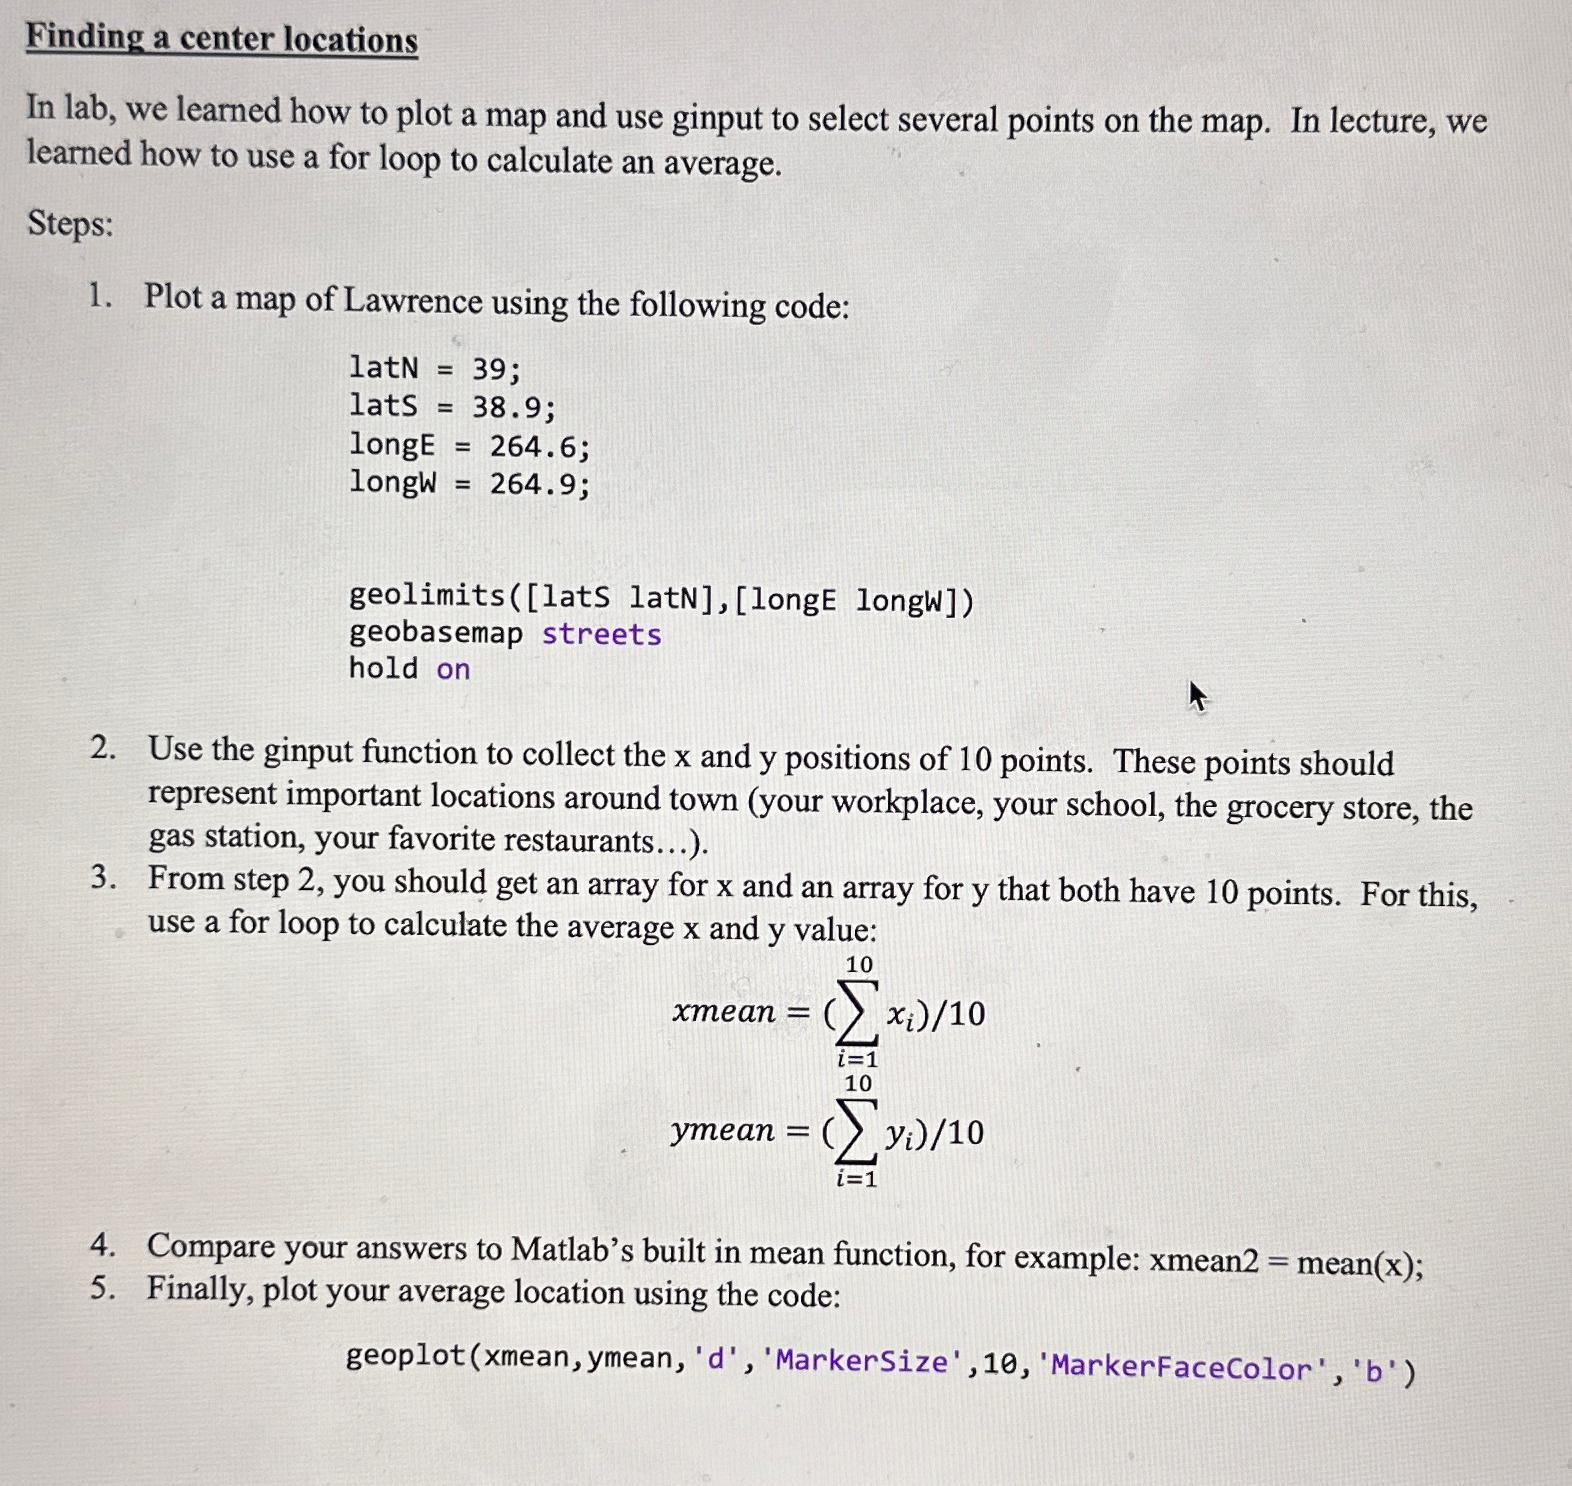
In lab, we learned how to plot a map and use ginput to select several points on the map. In lecture, we learned how to use a for loop to calculate an average.
Steps:
Plot a map of Lawrence using the following code:
lat ;
lats ;
long ;
longW ;
geolimitslats latNlongE longW
geobasemap streets
hold on
Use the ginput function to collect the and positions of points. These points should represent important locations around town your workplace, your school, the grocery store, the gas station, your favorite restaurants...
From step you should get an array for and an array for that both have points. For this, use a for loop to calculate the average and value:
xmean
ymean
Compare your answers to Matlab's built in mean function, for example: mean mean;
Finally, plot your average location using the code:
geoplot xmean ymean, d 'MarkerSize 'MarkerFaceColor' b
Step by Step Solution
There are 3 Steps involved in it
Step: 1

Get Instant Access to Expert-Tailored Solutions
See step-by-step solutions with expert insights and AI powered tools for academic success
Step: 2

Step: 3
Ace Your Homework with AI
Get the answers you need in no time with our AI-driven, step-by-step assistance
Get Started
Data Infrastructure For Medical Research In Databases
Authors: Thomas Heinis ,Anastasia Ailamaki
1st Edition
1680833480, 978-1680833485