

Question
Finish the code to match the guidelines: #include #include //provides definitions for using PLplot library #include #include #define NUM_POINTS 500 #define X_IX 0 #define FX_IX
Finish the code to match the guidelines:
#include
#define NUM_POINTS 500 #define X_IX 0 #define FX_IX 1 #define TRUE 1 #define FALSE 0
typedef stuct { int fNumber; double x0; double xf; } F_SELECT;
void selectFunction (F_SELECT *); void computeDataPoints (F_SELECT *fsPtr, int n, double [][n]); double calcFx(double, int); void plot(int n, double [][n]); double getMinDouble (double[], int); double getMaxDouble (double [],int);
int main() { F_SELECT fselect; double points[2][NUM_POINTS]; selectFunction (&fselect); computeDataPoints(&fselect, NUM_POINTS, points); plot(NUM_POINTS, points); }
/*---------------------------------------------------------------------------- Function: selectFunction Parameters: sfPtr: - Pointer to F_SELECT structuere variable to store input data. Description: Prompts the user to get x0 and xf (range for x for plotting) and to select a function to plot. -----------------------------------------------------------------------------*/ void selectFunction(F_SELECT *sfPtr) { // Vairable Declarations int flag; //display function menu printf("1) f(x) = sqrt(|x-1|) + 1 "); printf("2) f(x) = exp(-x) "); printf("3) f(x) = sqrt(x^2+1) - x "); printf("4) f(x) = [exp(-x)-1)]/x "); printf("5) f(x) = sin(x)+0.1*cos(10.0*x) "); //select a function
//select a range of x for plotting
}
/*---------------------------------------------------------------------------- Function: computeDataPoints Parameters: fsPtr: - Pointer to F_SELECT structuere variable to store input data. n - number of points in the 2D array (i.e. number of columns) points - 2D array that contains the data points - row X_IX with x values and row FX_IX with the f(x) values. Description: Calculates NUM_POINTS points of the function f(x) (selected by the user and computed with calcFx), and stored in the 2D array points. points [X_IX] is the 1D array (row X_IX) that contains the x values while points [FX_IX] is the 1D array 9row FX_IX) that contains the f(x) values. -----------------------------------------------------------------------------*/ void computeDataPoints (F_SELECT *fsPtr, int n, double points [][n]) { int ix; //for indexing points double x; //for incremementing values of x double inc; //incrementation value of x //setup loop that computes the points and stores in 2D array //A determinant loop is used to increment x, calcualte f(x) // and store the values in 2D array.
}
/*---------------------------------------------------------------------------- Function: calcFc Parameters: x - the value of x functionNum - function number to select function for calculation Description: Calculates teh value of f(x). In this case f(x) is selected using functionNum. -----------------------------------------------------------------------------*/ double calcFx(double x) { //variable declarations double fx; //instructions fx = sin(x); return (fx); }
/*---------------------------------------------------------------------------- Function: plot() Parameters: numPoints: number of points in the array, i.e. number of columns pointsL reference to 2D array Description: Initalizes the plot. The following values in the referenced structures are used to setup. the plot: points[X_IX][0], points[X_IX][nbrPoints-1] range of horizontal axis minfx, maxFx - vertical axis range Note the that the values of minFx and maxFx are determined with the functions getMindouble and getMaxDouble. The values in the row X_IX are assumed to be sorted in increasing order. Then plots the curved accessed using the contents of each row, that it, points [X_IX] and points [FX_IX] which are both referen ees to 1D arrays. -----------------------------------------------------------------------------*/ void plot(int numPoints, double points[][numPoints]) { //variable declaration double minFx, maxFx; //Minimum and maximum values of f(x) //setup plot configuration plsdev("wingcc"); //Sets device to wingcc - Codeblocks complier //Initalize the plot plinit(); //Configure the axis and labels plwidth(3); //select the width of the pen minFx = getMinDouble(points[FX_IX], numPoints); maxFx = getMaxDouble(points[FX_IX], numPoints); plenv(points[X_IX][0], points[X_IX][numPoints-1], moxFx, maxFx, 0, 0); plcol0(GREEN); //Select color for labels pllab("x", "f(x)", "Plot of f(x) versus x"); //plot the function plcol0(BLUE); //Color for plotting curve plline(numPoints, points[X_IX], points[FX_IX]); plend(); }
/*---------------------------------------------------------------------------- Function: getMinDouble Parameters: arr: reference to array of double values n: number of elements in the array Return value: the smallest value found in array. Description: Finds the smallest value in the array. Uses a derminante loop to traverse the array to test each value in the array -----------------------------------------------------------------------------*/ double getMinDouble(double arr[], int n) { //Variable declarations double min; //for storing minimum value int ix; //indexing intp an array //instructions min = DBL_MAX; //most positive value for type double for(ix=0; ix
/*---------------------------------------------------------------------------- Function: getMaxDouble Parameters: arr: reference to array of double values n: number of elements in the array Return value: the largest value found in array. Description: Finds the largest value in the array. Uses a derminante loop to traverse the array to test each value in the array -----------------------------------------------------------------------------*/ double getMaxDouble(double arr[], int n) { //Variable declarations double max; //for storing maximum value int ix; //indexing intp an array //instructions max = -DBL_MAX; //most negative value for type double for(ix=0; ix Here are the guidelines: 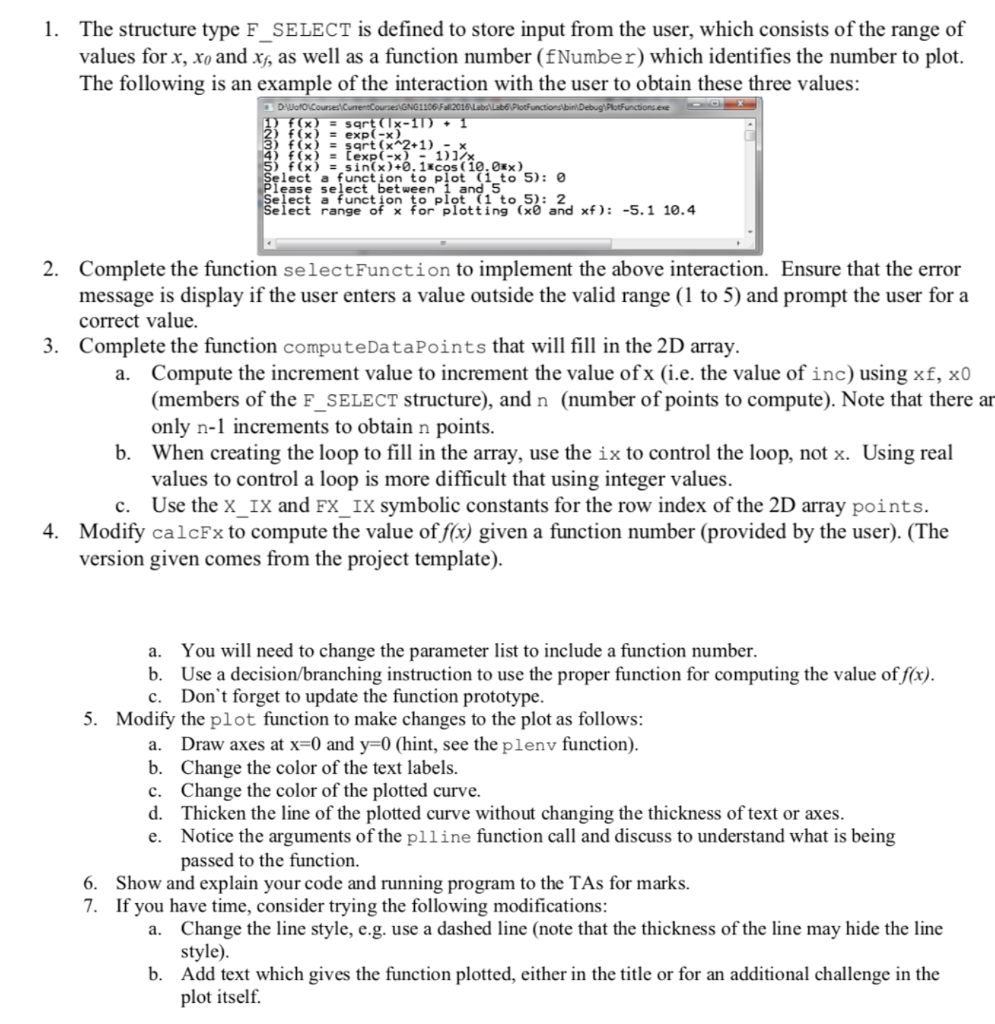
Step by Step Solution
There are 3 Steps involved in it
Step: 1

Get Instant Access to Expert-Tailored Solutions
See step-by-step solutions with expert insights and AI powered tools for academic success
Step: 2

Step: 3
Ace Your Homework with AI
Get the answers you need in no time with our AI-driven, step-by-step assistance
Get Started
Machine Learning And Knowledge Discovery In Databases European Conference Ecml Pkdd 2014 Nancy France September 15 19 2014 Proceedings Part 2 Lnai 8725
Authors: Toon Calders ,Floriana Esposito ,Eyke Hullermeier ,Rosa Meo
2014th Edition
3662448505, 978-3662448502