

Question
Fire Station Location Problem Problem Description The local government of Gainesville is concerned about finding a location to build a new fire station. They believe
 Fire Station Location Problem
Problem Description
The local government of Gainesville is concerned about finding a location to build a new fire station. They believe the station should be located in such a way that allows the firefighters to respond in a timely manner to emergencies. Facts that influence this decision are as follows: (a) the risk of fire is not the same in all areas. Industrial parts of the town are more vulnerable to fire; (b) population is not spread equally around the town, and, as a result, there are parts of the town that are more populated than others. It has been shown that the frequency of incidents is higher in the most populated areas.
We would like to develop a decision support system that will help the local government to decide about the location for the new fire station. We present a mathematical formulation of this problem.
Optimization Model
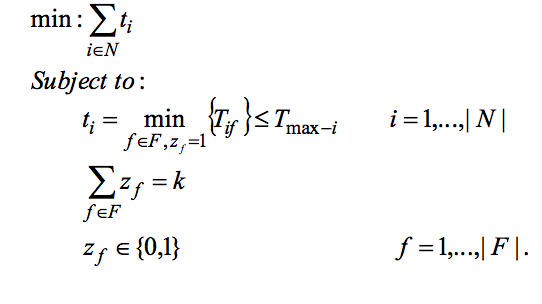
The objective of this problem is to determine a location for the fire station that will keep the response time under a pre-determined maximum response time. It seems logical to locate the fire station close to the most populated areas of the town and close to the areas that are vulnerable to fire. The input data for this problem would be the location of households and businesses. However, since it is difficult to collect and manage the data for each household, we group the population into N population hubs. Each population hub is represented by a set of co-ordinates. Let Pi be the population of hub i (i = 1,, |N|). The maximum response time of hub i is TMax-i. There are F possible locations in the town that are feasible for building the fire station (F N). Tif is the time it takes to reach the population of hub i from location f. We use Euclidean distances to measure the distance between every two locations. We assume that the average travel time between two locations is proportional to the distance between them. We assume that the costs of building and maintaining the fire station are of secondary concern in this problem, and therefore we do not include them in this formulation. The decision variables are the binary variables zf (f =1,,|F|) that take the value 1 if the fire station is located at location f, and 0 otherwise. The minimum response time to reach population i from a prospective fire station location f is given by ti= Min {Tif} for f F and zf=1.
Note the following: In our problem we state that the local government is planning to build one fire station (k =1). In the case that the problem is not feasible for k =1 (the maximum response time is not satisfied), the user can increase k until a feasible solution to this problem is found.
Excel Spreadsheets
1.Build a spreadsheet that provides the following information about each population hub: co-ordinates of its location, corresponding population, frequency of incidents, and maximum required response time.
2.Build a spreadsheet that presents the set of all feasible locations for the fire station.
3.Build a spreadsheet that presents the distance among potential fire station locations and population hubs.
User Interface
1.Build a welcome form.
2.The following are instructions for creating this form.
a.Insert a text box where the user can type in the total number of fire stations to be built.
b.Insert two text boxes where the user can choose a lower bound (lbk) and an upper bound (ubk) of the values that k takes. In this case the problem will be solved (ubk - lbk + 1) times. Provide a table that presents for each value of k the corresponding total response time.
c.Insert a command button(s) that, when clicked on, opens one of the spreadsheets of the database and allows the user to add/update/delete the corresponding information.
d.Insert a command button that, when clicked on, solves the problem using the Excel solver.
3.Build a form that presents the following details about the final solution.
a.Provide a graphical presentation of the final solution. Population hubs and fire station locations are the nodes of the graph. The arcs of the graph represent the assignment of population hubs to fire stations.
b.Insert a frame that has two option buttons. The option buttons allow the user to choose the type of sensitivity analysis to be performed, a sensitivity analysis with respect to k or TMax. Insert a command button that, when clicked on, performs the sensitivity analysis and returns the results.
Design a logo for this project. Insert this logo in the forms created above. Pick a background color and a font color for the forms created. Include the following in the forms created: record navigation command buttons, record operations command buttons, and form operations command buttons as needed.
Reports
1.Build a report that presents details about the final solution. The report should indicate the best location(s) for the fire station and the corresponding response time.
2.Build a report that provides details about the sensitivity analysis.
Reference
Winston, L.W., Operations Research: Applications and Algorithms. Duxbury Press, 3rd Ed., 1994.
min : ti Subject to: max-il *3 fEF s 10,1) 9.3 min : ti Subject to: max-il *3 fEF s 10,1) 9.3Step by Step Solution
There are 3 Steps involved in it
Step: 1

Get Instant Access to Expert-Tailored Solutions
See step-by-step solutions with expert insights and AI powered tools for academic success
Step: 2

Step: 3
Ace Your Homework with AI
Get the answers you need in no time with our AI-driven, step-by-step assistance
Get Started
Put Your Data To Work 52 Tips And Techniques For Effectively Managing Your Database
Authors: Wes Trochlil
1st Edition
0880343079, 978-0880343077