Answered step by step
Verified Expert Solution
Question
1 Approved Answer
Fiscal years starting: January 1 2 3 5 6 7 8 9 2024 2025 2026 2027 2028 2029 2030 2031 2032 10 2033 11

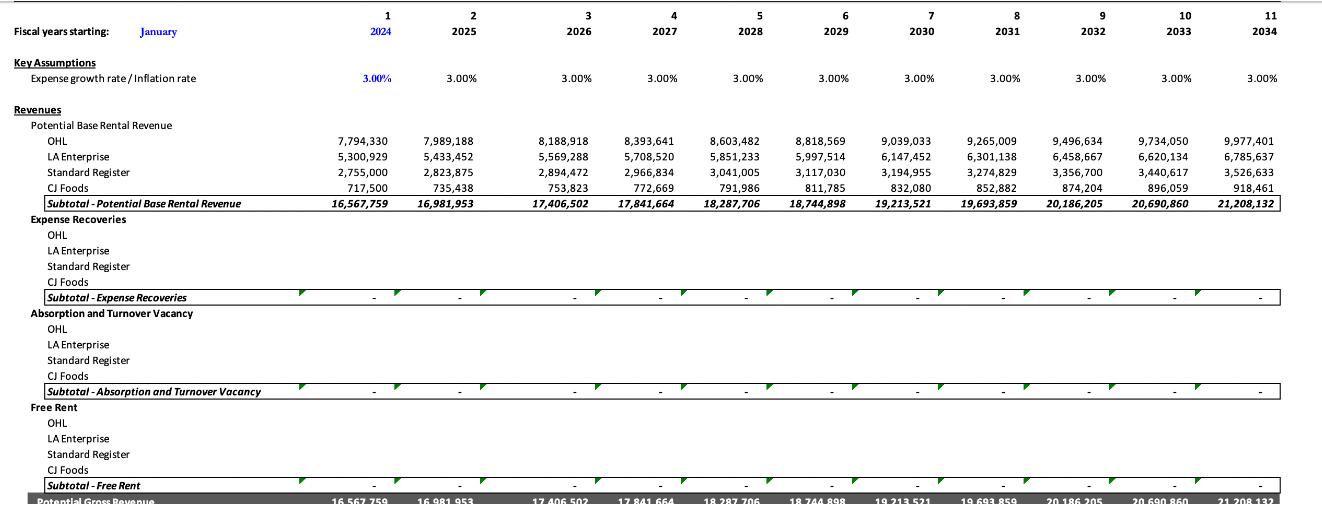
Fiscal years starting: January 1 2 3 5 6 7 8 9 2024 2025 2026 2027 2028 2029 2030 2031 2032 10 2033 11 2034 Key Assumptions Expense growth rate/Inflation rate 3.00% 3.00% 3.00% 3.00% 3.00% 3.00% 3.00% 3.00% 3.00% 3.00% 3.00% Revenues Potential Base Rental Revenue OHL LA Enterprise Standard Register CJ Foods Subtotal-Potential Base Rental Revenue Expense Recoveries OHL LA Enterprise Standard Register CJ Foods Subtotal-Expense Recoveries Absorption and Turnover Vacancy OHL LA Enterprise Standard Register CJ Foods Subtotal-Absorption and Turnover Vacancy Free Rent OHL LA Enterprise Standard Register CJ Foods Subtotal-Free Rent 7,794,330 7,989,188 5,300,929 5,433,452 8,188,918 5,569,288 8,393,641 8,603,482 5,708,520 5,851,233 8,818,569 5,997,514 9,039,033 6,147,452 2,755,000 717,500 16,567,759 2,823,875 2,894,472 2,966,834 3,041,005 3,117,030 3,194,955 9,265,009 6,301,138 3,274,829 9,496,634 6,458,667 9,734,050 6,620,134 9,977,401 6,785,637 3,356,700 3,440,617 3,526,633 735,438 16,981,953 753,823 17,406,502 772,669 17,841,664 791,986 18,287,706 811,785 18,744,898 832,080 19,213,521 852,882 19,693,859 874,204 20,186,205 896,059 20,690,860 918,461 21,208,132 Potential Gross Revenue 16 567 759 16 981 953 17 406 502 17 841 664 18 287 706 18 744 898 19 213 521 19 693.859 20 186 205 20 690 860 21 208 132
Step by Step Solution
There are 3 Steps involved in it
Step: 1

Get Instant Access to Expert-Tailored Solutions
See step-by-step solutions with expert insights and AI powered tools for academic success
Step: 2

Step: 3

Ace Your Homework with AI
Get the answers you need in no time with our AI-driven, step-by-step assistance
Get Started


