Answered step by step
Verified Expert Solution
Question
1 Approved Answer
Fitting a curve to your data in MATLAB can show trends and estimate values not included in the data set. n this problem, we will
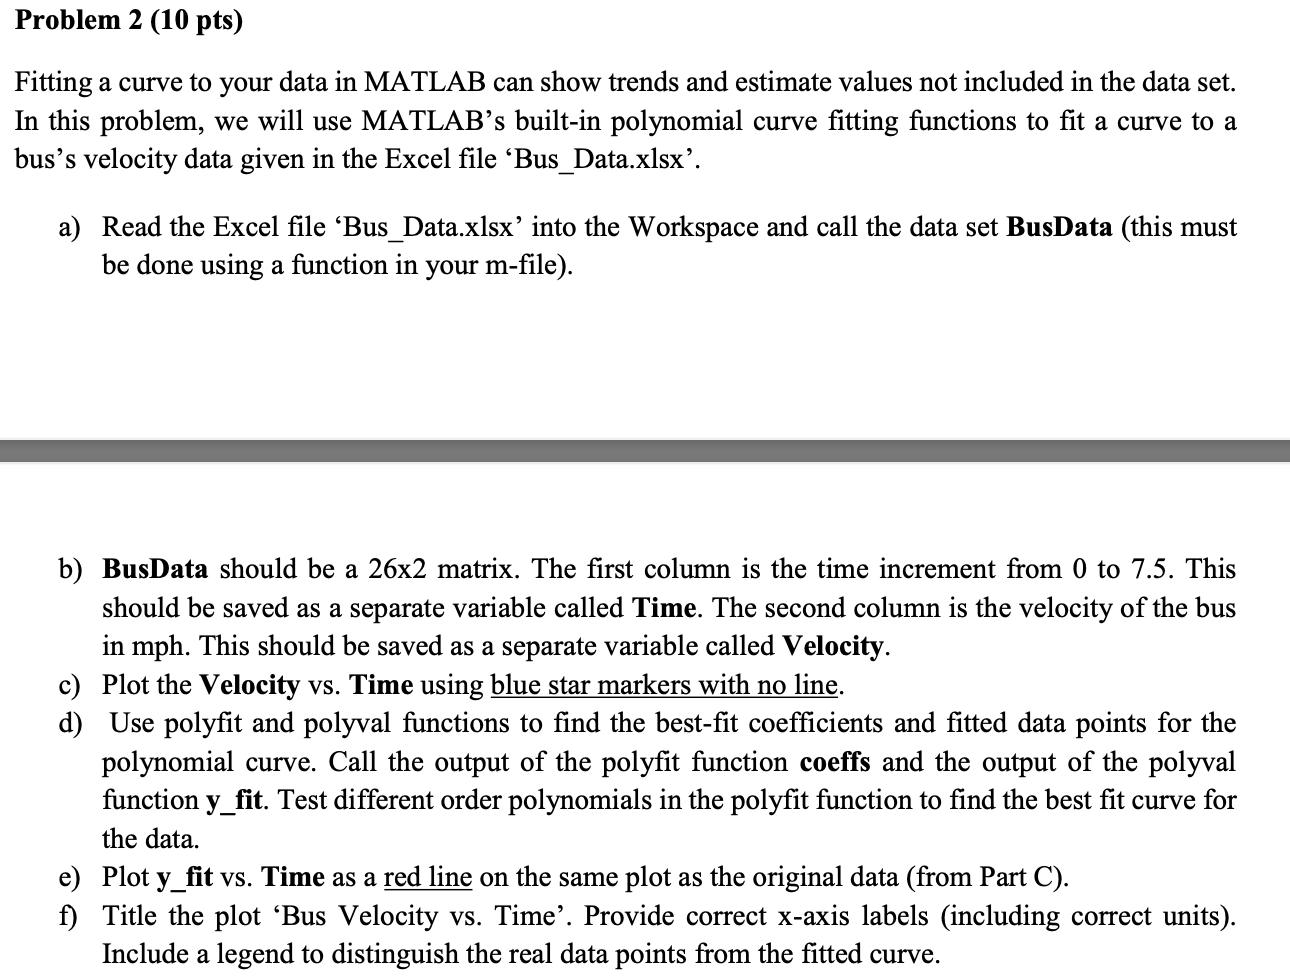
Fitting a curve to your data in MATLAB can show trends and estimate values not included in the data set. n this problem, we will use MATLAB's built-in polynomial curve fitting functions to fit a curve to a sus's velocity data given in the Excel file 'Bus_Data.xlsx'. a) Read the Excel file 'Bus_Data.xlsx' into the Workspace and call the data set BusData (this must be done using a function in your m-file). b) BusData should be a 262 matrix. The first column is the time increment from 0 to 7.5. This should be saved as a separate variable called Time. The second column is the velocity of the bus in mph. This should be saved as a separate variable called Velocity. c) Plot the Velocity vs. Time using blue star markers with no line. d) Use polyfit and polyval functions to find the best-fit coefficients and fitted data points for the polynomial curve. Call the output of the polyfit function coeffs and the output of the polyval function y_fit. Test different order polynomials in the polyfit function to find the best fit curve for the data. e) Plot y_fit vs. Time as a red line on the same plot as the original data (from Part C). f) Title the plot 'Bus Velocity vs. Time'. Provide correct x-axis labels (including correct units). Include a legend to distinguish the real data points from the fitted curve
Step by Step Solution
There are 3 Steps involved in it
Step: 1
Get Instant Access to Expert-Tailored Solutions
See step-by-step solutions with expert insights and AI powered tools for academic success
Step: 2
Step: 3
Ace Your Homework with AI
Get the answers you need in no time with our AI-driven, step-by-step assistance
Get Started