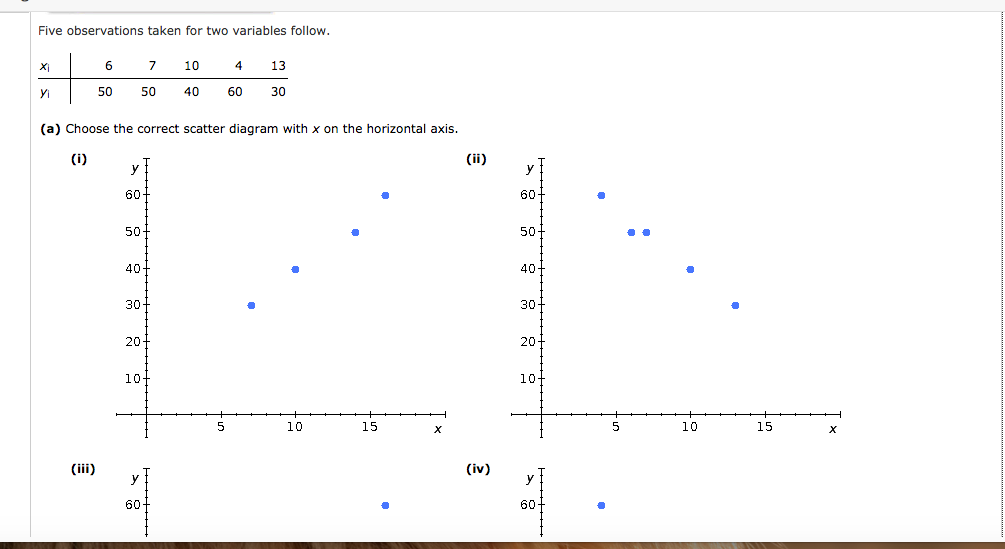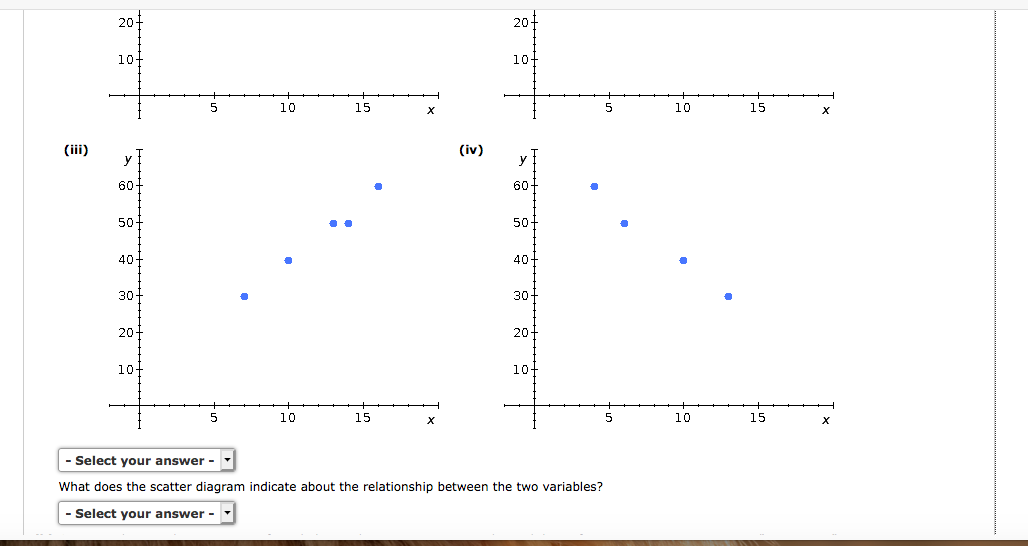


Five observations taken for two variables follow. XI 6 7 10 4 13 yi 50 50 40 60 30 (a) Choose the correct scatter diagram with x on the horizontal axis. (i) (ii) y 60 60 50 50 407 40 30 30 20+ 20 10+ 107 5 10 15 10 15 X (iii) (iv) 60 60 20 20 10 10+ 5 10 15 X 10 15 x (iv) 60 60 50 50 40+ 40 301 30 20 207 107 101 5 10 15 X 10 15 X Select you answer - What does the scatter diagram indicate about the relationship between the two variables? - Select your answer - 5 10 15 10 15 X - Select your answer - What does the scatter diagram indicate about the relationship between the two variables? - Select your answer - (b) Compute the sample covariance. If needed, round your answer to one decimal digit. If your answer is negative use "minus sign". Interpret the sample covariance. The input in the box below will not be graded, but may be reviewed and considered by your instructor. blank (c) Compute the sample correlation coefficient. If needed, round your answer to three decimal digits. If your answer is negative use "minus sign". Interpret the sample correlation coefficient. The input in the box below will not be graded, but may be reviewed and considered by your instructor. blank Five observations taken for two variables follow. XI 6 7 10 4 13 yi 50 50 40 60 30 (a) Choose the correct scatter diagram with x on the horizontal axis. (i) (ii) y 60 60 50 50 407 40 30 30 20+ 20 10+ 107 5 10 15 10 15 X (iii) (iv) 60 60 20 20 10 10+ 5 10 15 X 10 15 x (iv) 60 60 50 50 40+ 40 301 30 20 207 107 101 5 10 15 X 10 15 X Select you answer - What does the scatter diagram indicate about the relationship between the two variables? - Select your answer - 5 10 15 10 15 X - Select your answer - What does the scatter diagram indicate about the relationship between the two variables? - Select your answer - (b) Compute the sample covariance. If needed, round your answer to one decimal digit. If your answer is negative use "minus sign". Interpret the sample covariance. The input in the box below will not be graded, but may be reviewed and considered by your instructor. blank (c) Compute the sample correlation coefficient. If needed, round your answer to three decimal digits. If your answer is negative use "minus sign". Interpret the sample correlation coefficient. The input in the box below will not be graded, but may be reviewed and considered by your instructor. blank


