

Question: Follow the MATLAB Template provided and Write a MATLAB code please part (a-i): I have the temp_data loaded on my computer, i just need the
Follow the MATLAB Template provided and Write a MATLAB code please part(a-i):
I have the temp_data loaded on my computer, i just need the code.
%% disp(' ');
disp('*****problem2*****');
load temp_data.mat
%For convenience, you may want to extract each column of the data matrix into a separate %vector; it's not strictly necessary, but it makes the syntax simpler %Here's a model of how to comment each part and display the results
%problem 2a - avg. daily temp anomaly, 1880 - 1948 prob2a = 0; %complete this line disp(['Avg temp anomaly 1880 - 1948 : ', num2str(prob2a)])
%If using the checker use these variable names for subsequent parts prob2b = 0;
prob2c = 0;
prob2d = 0;
%part e %checker looks for max temp anomaly and the year, month & day where it occurs prob2e_T = 0; %temp anomaly value prob2e_year = 0; prob2e_month = 0; prob2e_day = 0;
prob2f = 0;
%part g - check looks for row number (index) prob2g = 0;
prob2h = 0;
%part i - checker doesn't check this part, since you know that the answer %is 0
%part j - checker doesn't check this part, since the problem contains %verification instructions
- What was the average daily temperature anomaly for the years 1880 1948?
- What was the average daily temperature anomaly for the years 1950 2018?
- On how many days in 1880 1948 was the temperature anomaly positive?
- On how many days in 1950 2018 was the temperature anomaly positive?
- What was the date (month, day, and year) on which the highest-ever temperature anomaly occurred?
- What is the difference between the highest-ever and lowest-ever temperature anomalies?
- What was the date the last time the temperature anomaly was negative?
- How many days was the temperature anomaly in 2018 greater than the temperature anomaly on the corresponding date in 1978?
HYPOTHETICAL SCENARIO #1: Some errors occurred during data collection for 1949, so that some of the elements of column 4 of the matrix do not contain valid numerical 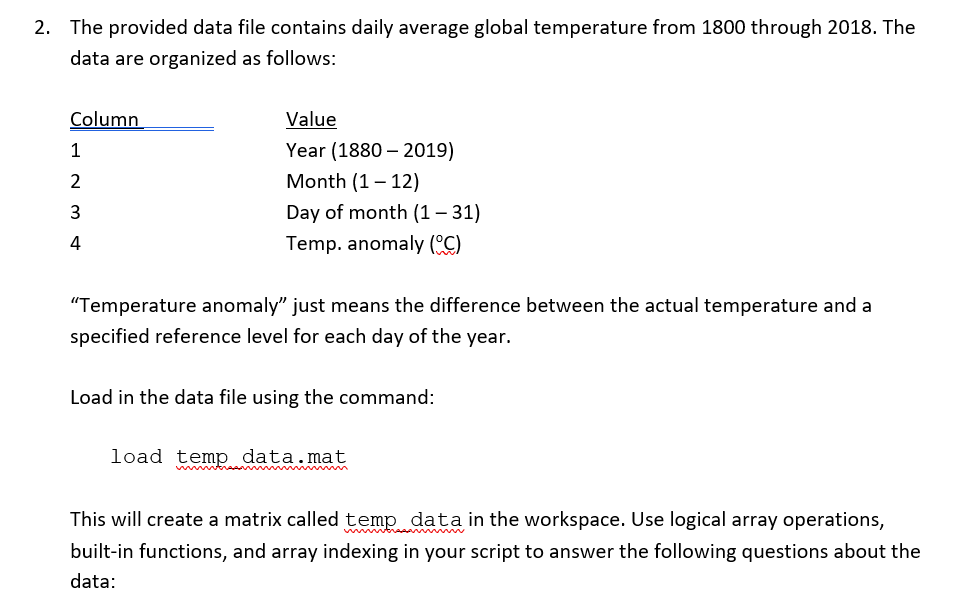
2. The provided data file contains daily average global temperature from 1800 through 2018. The data are organized as follows: Column Value Year (1880 2019) Month (1-12) Day of month (1 31) Temp. anomaly (C) "Temperature anomaly" just means the difference between the actual temperature and a specified reference level for each day of the year. Load in the data file using the command: load temp data.mat This will create a matrix called temp data in the workspace. Use logical array operations, built-in functions, and array indexing in your script to answer the following questions about the data: 2. The provided data file contains daily average global temperature from 1800 through 2018. The data are organized as follows: Column Value Year (1880 2019) Month (1-12) Day of month (1 31) Temp. anomaly (C) "Temperature anomaly" just means the difference between the actual temperature and a specified reference level for each day of the year. Load in the data file using the command: load temp data.mat This will create a matrix called temp data in the workspace. Use logical array operations, built-in functions, and array indexing in your script to answer the following questions about the data
Step by Step Solution
There are 3 Steps involved in it

Get step-by-step solutions from verified subject matter experts