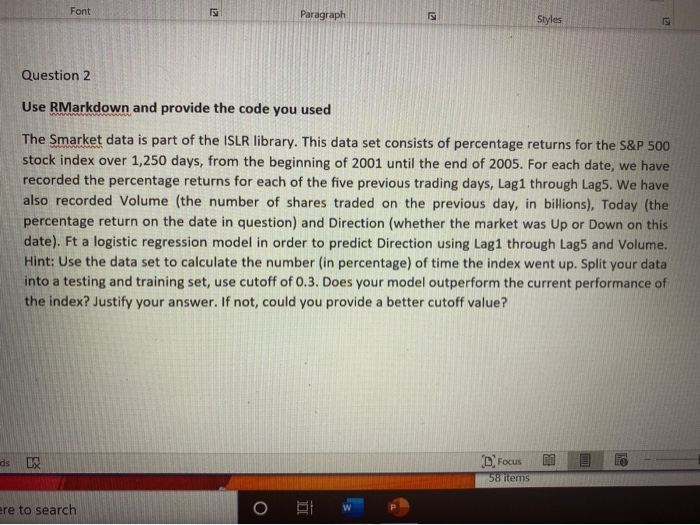
Font 2 Paragraph Styles 2 Question 2 Use RMarkdown and provide the code you used The Smarket data is part of the ISLR library. This data set consists of percentage returns for the S&P 500 stock index over 1,250 days, from the beginning of 2001 until the end of 2005. For each date, we have recorded the percentage returns for each of the five previous trading days, Lag1 through Lag5. We have also recorded Volume (the number of shares traded on the previous day, in billions), Today (the percentage return on the date in question) and Direction (whether the market was Up or Down on this date). Ft a logistic regression model in order to predict Direction using Lag1 through Lag5 and Volume. Hint: Use the data set to calculate the number (in percentage) of time the index went up. Split your data into a testing and training set, use cutoff of 0.3. Does your model outperform the current performance of the index? Justify your answer. If not, could you provide a better cutoff value? B ds Focus 58 items ere to search PL W O Font 2 Paragraph Styles 2 Question 2 Use RMarkdown and provide the code you used The Smarket data is part of the ISLR library. This data set consists of percentage returns for the S&P 500 stock index over 1,250 days, from the beginning of 2001 until the end of 2005. For each date, we have recorded the percentage returns for each of the five previous trading days, Lag1 through Lag5. We have also recorded Volume (the number of shares traded on the previous day, in billions), Today (the percentage return on the date in question) and Direction (whether the market was Up or Down on this date). Ft a logistic regression model in order to predict Direction using Lag1 through Lag5 and Volume. Hint: Use the data set to calculate the number (in percentage) of time the index went up. Split your data into a testing and training set, use cutoff of 0.3. Does your model outperform the current performance of the index? Justify your answer. If not, could you provide a better cutoff value? B ds Focus 58 items ere to search PL W O


