Answered step by step
Verified Expert Solution
Question
1 Approved Answer
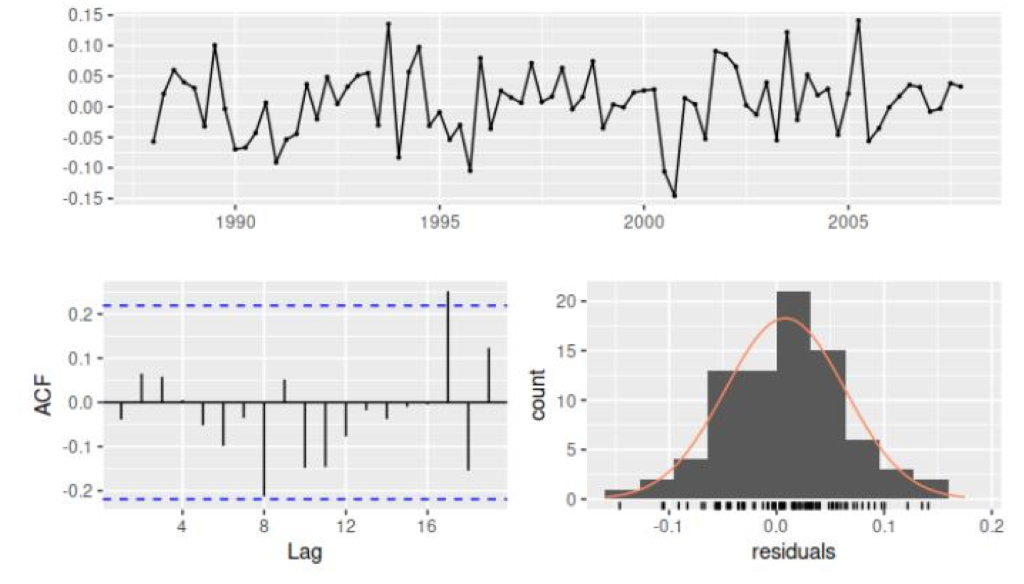
For a given forecasting model, the figures below show the residual time plot (top figure), the ACF plot of the residuals (bottom left figure) and
For a given forecasting model, the figures below show the residual time plot (top figure), the ACF plot of the residuals (bottom left figure) and the histogram of residuals (bottom right figure). a) Does the forecasting model adequately capture all the information (dynamics) in the data? Ignore barely significant spikes. How did you reach this conclusion?
b) Is the model unbiased? How did you reach this conclusion?
c) Will the computation of prediction intervals likely be accurate? How did you reach this conclusion?

Step by Step Solution
There are 3 Steps involved in it
Step: 1

Get Instant Access to Expert-Tailored Solutions
See step-by-step solutions with expert insights and AI powered tools for academic success
Step: 2

Step: 3

Ace Your Homework with AI
Get the answers you need in no time with our AI-driven, step-by-step assistance
Get Started


