For each account on this companys balance sheet, show the change in the account during 2019 and note whether this change was a source or use of cash. Do your numbers add up and make sense? Explain your answer for total assets as compared to your answer for total liabilities and owners equity.
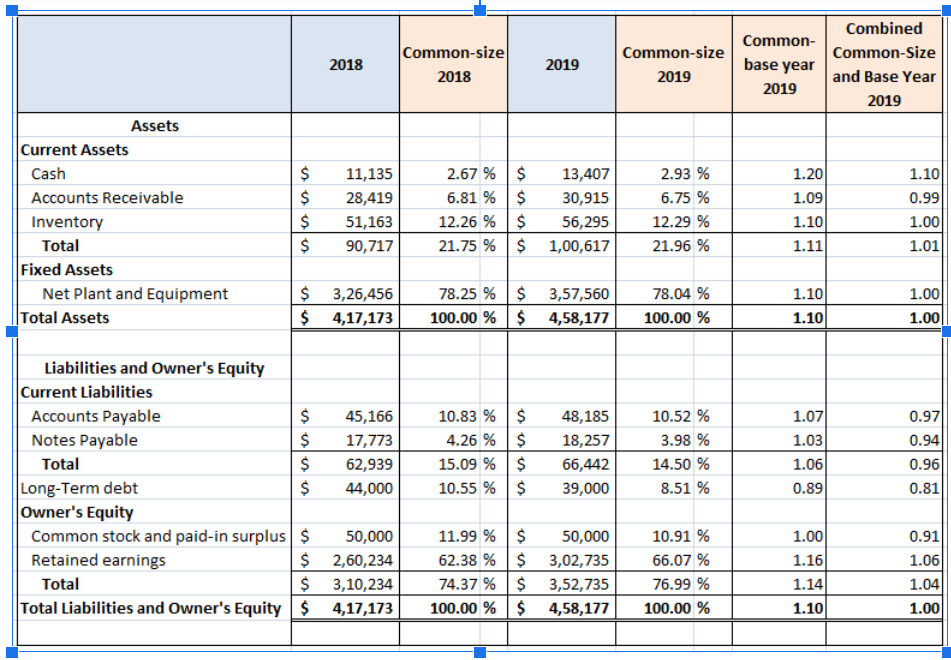
Combined Common- Common-size Common-size Common-Size 2018 2019 base year 2018 2019 and Base Year 2019 2019 Assets Current Assets Cash 11,135 2.93 % Accounts Receivable 28,419 6.75 % $ $ $ $ 2.67 %$ 13,407 6.81 %$ 30,915 12.26 %$ 56,295 21.75 %$ 1,00,617 1.200 1.09 1.100 1.11 1.10 0.99 1.00 51,163 12.29 % 90,717 21.96 % 1.01 Inventory Total Fixed Assets Net Plant and Equipment Total Assets 3,26,456 78.04 % 1.00 $ $ 78.25 %$ 3,57,560 100.00 % $ 4,58,177 1.101 1.10 4,17,173 100.00% 1.00 45,166 48,185 10.52 % 0.97 17,773 18,257 3.98 % 0.94 10.83 % $ 4.26 %$ 15.09 %$ 10.55 % $ 1.07 1.03 1.06 0.89 62,939 66,442 Liabilities and Owner's Equity Current Liabilities Accounts Payable $ Notes Payable $ Total $ Long-Term debt $ Owner's Equity Common stock and paid-in surplus $ Retained earnings $ Total $ Total Liabilities and Owner's Equity $ 14.50 % 0.96 44,000 39,000 8.51 % 0.81 50,000 10.91 % 0.91 2,60,234 66.07 % 1.06 11.99 % $ 50,000 62.38 %$ 3,02,735 74.37 % $ 3,52,735 100.00 %$ 4,58,177 1.001 1.16 1.14 1.10 3,10,234 76.99 % 1.04 4,17,173 100.00 % 1.00 Combined Common- Common-size Common-size Common-Size 2018 2019 base year 2018 2019 and Base Year 2019 2019 Assets Current Assets Cash 11,135 2.93 % Accounts Receivable 28,419 6.75 % $ $ $ $ 2.67 %$ 13,407 6.81 %$ 30,915 12.26 %$ 56,295 21.75 %$ 1,00,617 1.200 1.09 1.100 1.11 1.10 0.99 1.00 51,163 12.29 % 90,717 21.96 % 1.01 Inventory Total Fixed Assets Net Plant and Equipment Total Assets 3,26,456 78.04 % 1.00 $ $ 78.25 %$ 3,57,560 100.00 % $ 4,58,177 1.101 1.10 4,17,173 100.00% 1.00 45,166 48,185 10.52 % 0.97 17,773 18,257 3.98 % 0.94 10.83 % $ 4.26 %$ 15.09 %$ 10.55 % $ 1.07 1.03 1.06 0.89 62,939 66,442 Liabilities and Owner's Equity Current Liabilities Accounts Payable $ Notes Payable $ Total $ Long-Term debt $ Owner's Equity Common stock and paid-in surplus $ Retained earnings $ Total $ Total Liabilities and Owner's Equity $ 14.50 % 0.96 44,000 39,000 8.51 % 0.81 50,000 10.91 % 0.91 2,60,234 66.07 % 1.06 11.99 % $ 50,000 62.38 %$ 3,02,735 74.37 % $ 3,52,735 100.00 %$ 4,58,177 1.001 1.16 1.14 1.10 3,10,234 76.99 % 1.04 4,17,173 100.00 % 1.00