

Answered step by step
Verified Expert Solution
Question
1 Approved Answer
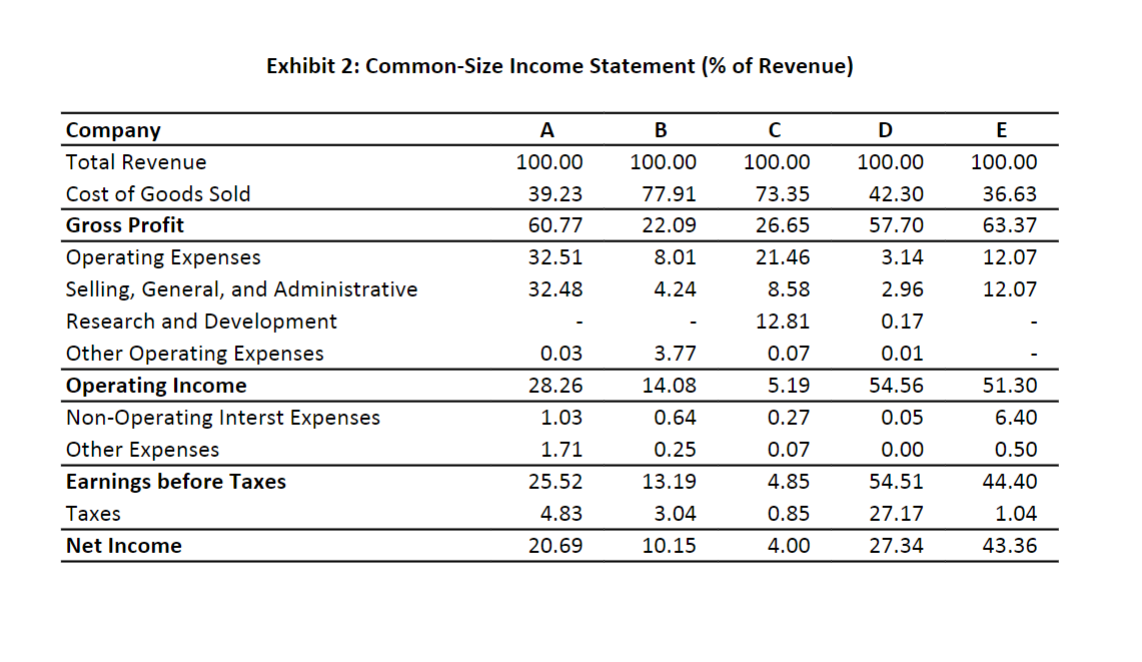
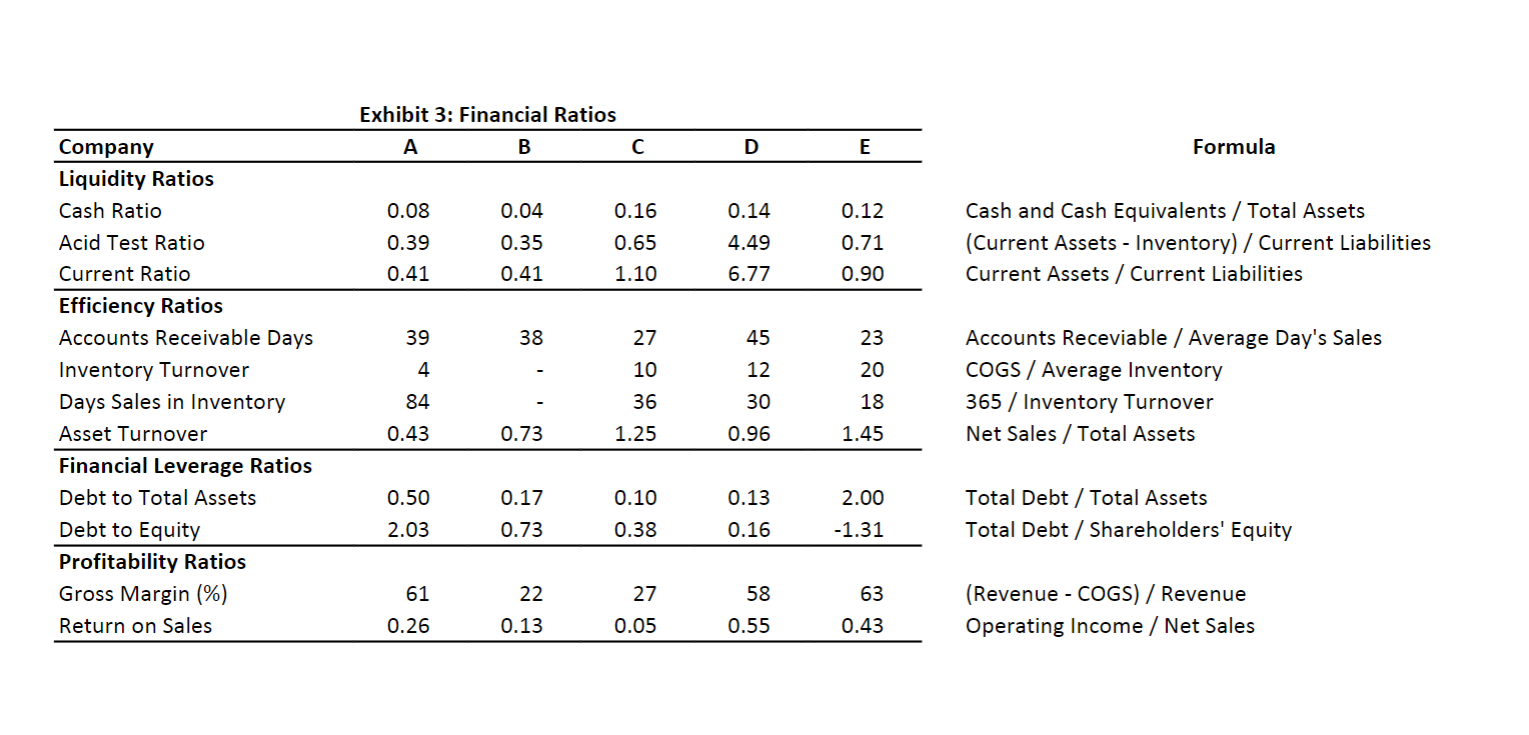
FOR EACH COMPANY (A-E), IDENTIFY WHICH INDUSTRY IT OPREATES IN, AND EXPLAIN Financial statements and ratios can reveal industry-specific differences in financial and operational strategies.
FOR EACH COMPANY (A-E), IDENTIFY WHICH INDUSTRY IT OPREATES IN, AND EXPLAIN
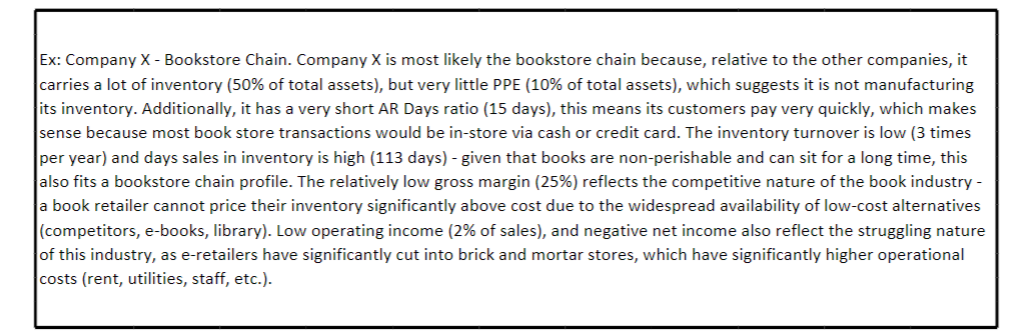
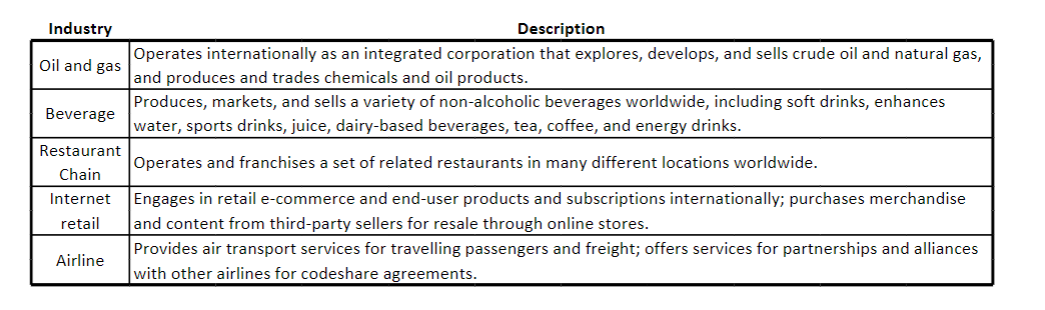
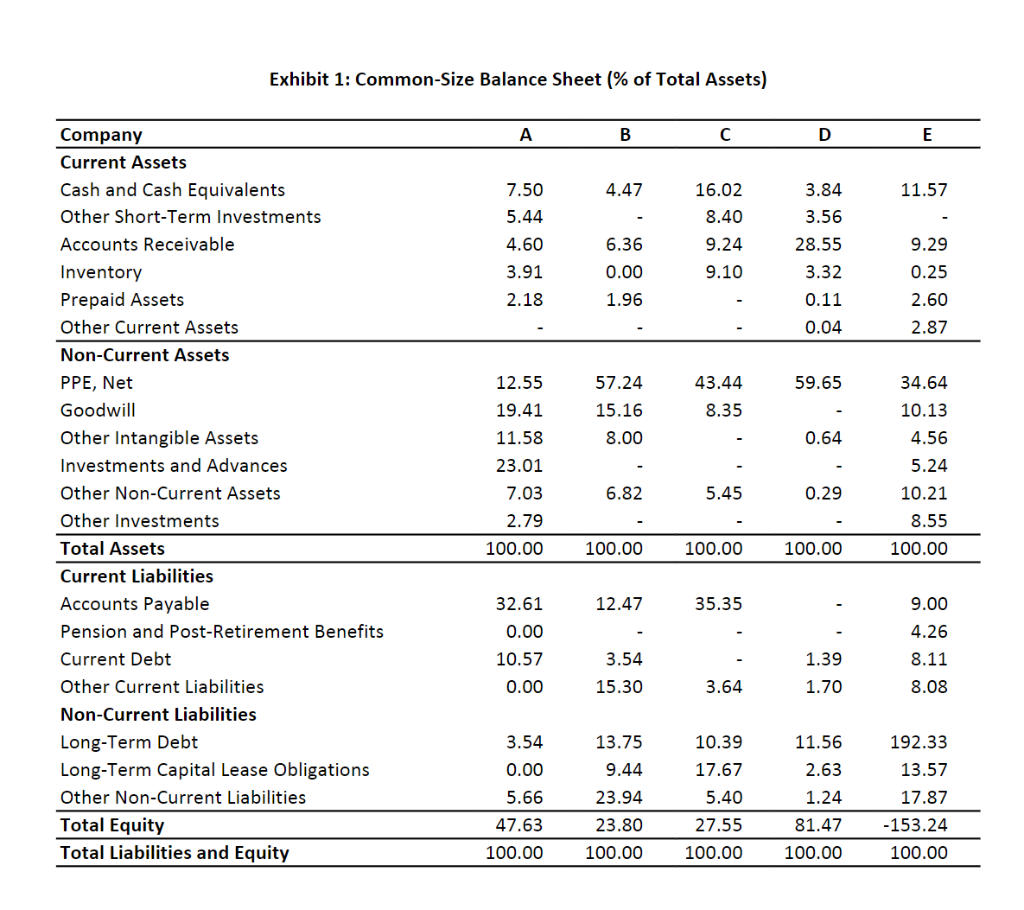
Financial statements and ratios can reveal industry-specific differences in financial and operational strategies. Within an industry, companies often have similar-looking financials. For example, manufacturing companies tend to have higher PPE than those in service industries. The average period of time it takes collect accounts receivable should be higher for banks than non-financial firms because banks offer long-term loans, whereas most companies selling goods/services require payment in 3090 days. The goal of this assignment is to improve your understanding of financial statement analysis and ratio analysis by recognizing industry differences. Financial information for 5 companies operating in 5 different industries will be provided - including common size balance sheets (Exhibit 1), income statements (Exhibit 2), and financial ratios (Exhibit 3). These companies are well-known, publicly traded, U.S. corporations. Their financial information reflects characteristics typical of their industries. You will need to identify which of the below industries each company operates in. Ex: Company X-Bookstore Chain. Company X is most likely the bookstore chain because, relative to the other companies, it carries a lot of inventory ( 50% of total assets), but very little PPE ( 10% of total assets), which suggests it is not manufacturing its inventory. Additionally, it has a very short AR Days ratio (15 days), this means its customers pay very quickly, which makes sense because most book store transactions would be in-store via cash or credit card. The inventory turnover is low (3 times per year) and days sales in inventory is high (113 days) - given that books are non-perishable and can sit for a long time, this also fits a bookstore chain profile. The relatively low gross margin (25\%) reflects the competitive nature of the book industry a book retailer cannot price their inventory significantly above cost due to the widespread availability of low-cost alternatives (competitors, e-books, library). Low operating income ( 2% of sales), and negative net income also reflect the struggling nature of this industry, as e-retailers have significantly cut into brick and mortar stores, which have significantly higher operational costs (rent, utilities, staff, etc.). Industry Description \begin{tabular}{|c|l|} \hline Oil and gas & Operates internationally as an integrated corporation that explores, develops, and sells crude oil and natural gas, and produces and trades chemicals and oil products. \\ \hline Beverage & Produces, markets, and sells a variety of non-alcoholic beverages worldwide, including soft drinks, enhances water, sports drinks, juice, dairy-based beverages, tea, coffee, and energy drinks. \\ \hline Restaurant Chain & Operates and franchises a set of related restaurants in many different locations worldwide. \\ \hline Internet retail & Engages in retail e-commerce and end-user products and subscriptions internationally; purchases merchandise and content from third-party sellers for resale through online stores. \\ \hline Airline & Provides air transport services for travelling passengers and freight; offers services for partnerships and alliances with other airlines for codeshare agreements. \\ \hline \end{tabular} Fvhihit 1. Cnmmnn_Cizo Ralaneo Choot lonf Tntal necotel Exhibit 2: Common-Size Income Statement (\% of Revenue Exhibit 3: Financial Ratios \begin{tabular}{lrrrrr} \hline Company & A & B & C & D & E \\ \hline Liquidity Ratios & & & & & \\ Cash Ratio & 0.08 & 0.04 & 0.16 & 0.14 & 0.12 \\ Acid Test Ratio & 0.39 & 0.35 & 0.65 & 4.49 & 0.71 \\ Current Ratio & 0.41 & 0.41 & 1.10 & 6.77 & 0.90 \\ \hline Efficiency Ratios & & & & & \\ Accounts Receivable Days & 39 & 38 & 27 & 45 & 23 \\ Inventory Turnover & 4 & & 10 & 12 & 20 \\ Days Sales in Inventory & 84 & & 36 & 30 & 18 \\ Asset Turnover & 0.43 & 0.73 & 1.25 & 0.96 & 1.45 \\ \hline Financial Leverage Ratios & & & & & \\ Debt to Total Assets & 0.50 & 0.17 & 0.10 & 0.13 & 2.00 \\ Debt to Equity & 2.03 & 0.73 & 0.38 & 0.16 & 1.31 \\ \hline Profitability Ratios & & & & & \\ Gross Margin (\%) & 61 & 22 & 27 & 58 & 63 \\ Return on Sales & 0.26 & 0.13 & 0.05 & 0.55 & 0.43 \\ \hline \end{tabular} Formula Cash and Cash Equivalents / Total Assets (Current Assets - Inventory) / Current Liabilities Current Assets / Current Liabilities Accounts Receviable / Average Day's Sales COGS / Average Inventory 365 / Inventory Turnover Net Sales / Total Assets Total Debt / Total Assets Total Debt / Shareholders' Equity (Revenue - COGS) / Revenue Operating Income / Net Sales Financial statements and ratios can reveal industry-specific differences in financial and operational strategies. Within an industry, companies often have similar-looking financials. For example, manufacturing companies tend to have higher PPE than those in service industries. The average period of time it takes collect accounts receivable should be higher for banks than non-financial firms because banks offer long-term loans, whereas most companies selling goods/services require payment in 3090 days. The goal of this assignment is to improve your understanding of financial statement analysis and ratio analysis by recognizing industry differences. Financial information for 5 companies operating in 5 different industries will be provided - including common size balance sheets (Exhibit 1), income statements (Exhibit 2), and financial ratios (Exhibit 3). These companies are well-known, publicly traded, U.S. corporations. Their financial information reflects characteristics typical of their industries. You will need to identify which of the below industries each company operates in. Ex: Company X-Bookstore Chain. Company X is most likely the bookstore chain because, relative to the other companies, it carries a lot of inventory ( 50% of total assets), but very little PPE ( 10% of total assets), which suggests it is not manufacturing its inventory. Additionally, it has a very short AR Days ratio (15 days), this means its customers pay very quickly, which makes sense because most book store transactions would be in-store via cash or credit card. The inventory turnover is low (3 times per year) and days sales in inventory is high (113 days) - given that books are non-perishable and can sit for a long time, this also fits a bookstore chain profile. The relatively low gross margin (25\%) reflects the competitive nature of the book industry a book retailer cannot price their inventory significantly above cost due to the widespread availability of low-cost alternatives (competitors, e-books, library). Low operating income ( 2% of sales), and negative net income also reflect the struggling nature of this industry, as e-retailers have significantly cut into brick and mortar stores, which have significantly higher operational costs (rent, utilities, staff, etc.). Industry Description \begin{tabular}{|c|l|} \hline Oil and gas & Operates internationally as an integrated corporation that explores, develops, and sells crude oil and natural gas, and produces and trades chemicals and oil products. \\ \hline Beverage & Produces, markets, and sells a variety of non-alcoholic beverages worldwide, including soft drinks, enhances water, sports drinks, juice, dairy-based beverages, tea, coffee, and energy drinks. \\ \hline Restaurant Chain & Operates and franchises a set of related restaurants in many different locations worldwide. \\ \hline Internet retail & Engages in retail e-commerce and end-user products and subscriptions internationally; purchases merchandise and content from third-party sellers for resale through online stores. \\ \hline Airline & Provides air transport services for travelling passengers and freight; offers services for partnerships and alliances with other airlines for codeshare agreements. \\ \hline \end{tabular} Fvhihit 1. Cnmmnn_Cizo Ralaneo Choot lonf Tntal necotel Exhibit 2: Common-Size Income Statement (\% of Revenue Exhibit 3: Financial Ratios \begin{tabular}{lrrrrr} \hline Company & A & B & C & D & E \\ \hline Liquidity Ratios & & & & & \\ Cash Ratio & 0.08 & 0.04 & 0.16 & 0.14 & 0.12 \\ Acid Test Ratio & 0.39 & 0.35 & 0.65 & 4.49 & 0.71 \\ Current Ratio & 0.41 & 0.41 & 1.10 & 6.77 & 0.90 \\ \hline Efficiency Ratios & & & & & \\ Accounts Receivable Days & 39 & 38 & 27 & 45 & 23 \\ Inventory Turnover & 4 & & 10 & 12 & 20 \\ Days Sales in Inventory & 84 & & 36 & 30 & 18 \\ Asset Turnover & 0.43 & 0.73 & 1.25 & 0.96 & 1.45 \\ \hline Financial Leverage Ratios & & & & & \\ Debt to Total Assets & 0.50 & 0.17 & 0.10 & 0.13 & 2.00 \\ Debt to Equity & 2.03 & 0.73 & 0.38 & 0.16 & 1.31 \\ \hline Profitability Ratios & & & & & \\ Gross Margin (\%) & 61 & 22 & 27 & 58 & 63 \\ Return on Sales & 0.26 & 0.13 & 0.05 & 0.55 & 0.43 \\ \hline \end{tabular} Formula Cash and Cash Equivalents / Total Assets (Current Assets - Inventory) / Current Liabilities Current Assets / Current Liabilities Accounts Receviable / Average Day's Sales COGS / Average Inventory 365 / Inventory Turnover Net Sales / Total Assets Total Debt / Total Assets Total Debt / Shareholders' Equity (Revenue - COGS) / Revenue Operating Income / Net SalesStep by Step Solution
There are 3 Steps involved in it
Step: 1

Get Instant Access to Expert-Tailored Solutions
See step-by-step solutions with expert insights and AI powered tools for academic success
Step: 2

Step: 3
Ace Your Homework with AI
Get the answers you need in no time with our AI-driven, step-by-step assistance
Get Started
Handbook Of Communication Audits For Organisations
Authors: Owen D.W. Hargie, Dennis Tourish
1st Edition
0415186420, 978-0415186421