

Question
For each of the following costs, identify the cost graph that best describes its cost behavior as the number of units produced and sold increases:
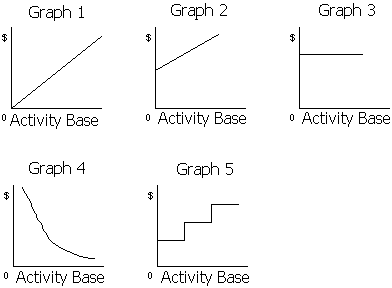
For each of the following costs, identify the cost graph that best describes its cost behavior as the number of units produced and sold increases:
| (a) | Sales commissions of $5,000 plus $.05 for each item sold. |
| (b) | Rent on warehouse of $10,000 per month. |
| (c) | Insurance costs of $2,500 per month. |
| (d) | Per-unit cost of direct labor. |
| (e) | Total salaries of quality control supervisors. One supervisor must be added for each additional work shift. |
| (f) | Total employer pension costs of $.30 per direct labor hour. |
| (g) | Per-unit straight-line depreciation costs. |
| (h) | Per-unit cost of direct materials. |
| (i) | Total direct materials cost. |
| (j) | Electricity costs of $5,000 per month plus $.0004 per kilowatt-hour. |
| (k) | Per-unit cost of plant superintendent's salary. |
| (l) | Per-unit cost of direct labor. |
| (m) | Repairs and maintenance costs of $3,000 for each 2,000 hours of factory machine usage. |
| (n) | Total direct labor cost. |
| (o) | Straight-line depreciation on factory equipment. |
Step by Step Solution
There are 3 Steps involved in it
Step: 1

Get Instant Access to Expert-Tailored Solutions
See step-by-step solutions with expert insights and AI powered tools for academic success
Step: 2

Step: 3
Ace Your Homework with AI
Get the answers you need in no time with our AI-driven, step-by-step assistance
Get Started
Cima Official Exam Practice Kit Test Of Professional Competence In Management Accounting 2008 Edition
Authors: Geoffrey Little
4th Edition
0750686804, 978-0750686808