

Question
For each question, you will conduct an appropriate test, and your work must include: 1. Clear statement of hypotheses, with the correct parameter(s) 2.An indication
For each question, you will conduct an appropriate test, and your workmust include:
1. Clear statement of hypotheses, with the correct parameter(s)
2.An indication of the test used
3.The test statistic and p-value
4.A clearly stated statistical decision (Reject Ho or Do not Reject Ho)
along with a justification for this decision.
5.An interpretation of the statistical decision in the context of the problem.
*** *******************
#1)A sample of 12 in-state undergraduate school programs for State A has a mean tuition of $24,000 with a standard deviation of $4,600. In State B, a sample of 16 in-state undergraduate programs has a mean of $28,000 with a standard deviation of $5,200. Assume that in-state tuitions are normally distributed for both states.Using a .05 significance level, does this sample data provide evidence that the mean tuition are different for the two states?
2. Parents of teenage boys often complain that auto insurance costs more, on average, for teenage boys than for teenage girls. A group of concerned parents examines a random sample of insurance bills. The mean annual cost for 36 teenage boys was $679. For 23 teenage girls, it was $559. From past years, it is known that auto insurance rates are normally distributed for both boys and girls, and the population standard deviation for each group is s = $180.At the .01 significance level, does this data provide evidence that the mean cost for auto insurance for teenage boys is greater than that for teenage girls?
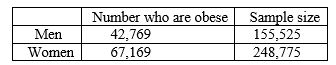
#3)Adults aged 18 years old and older were randomly selected for a survey on obesity. Adults are considered obese if their body mass index (BMI) is at least 30. The researchers wanted to determine if the proportion of women in the south who are obese is less than the proportion of southern men who are obese. The results are shown in the table below.
Step by Step Solution
There are 3 Steps involved in it
Step: 1

Get Instant Access to Expert-Tailored Solutions
See step-by-step solutions with expert insights and AI powered tools for academic success
Step: 2

Step: 3
Ace Your Homework with AI
Get the answers you need in no time with our AI-driven, step-by-step assistance
Get Started