For each situation, identify the sample size n, the probability of a success p, and the number of successes x. When asked for the probability,
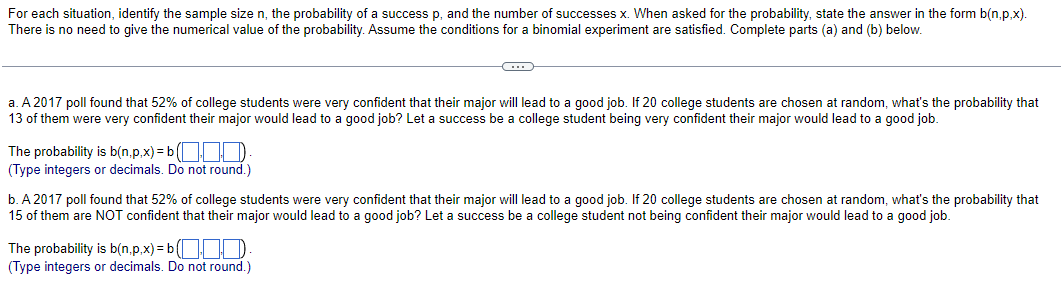
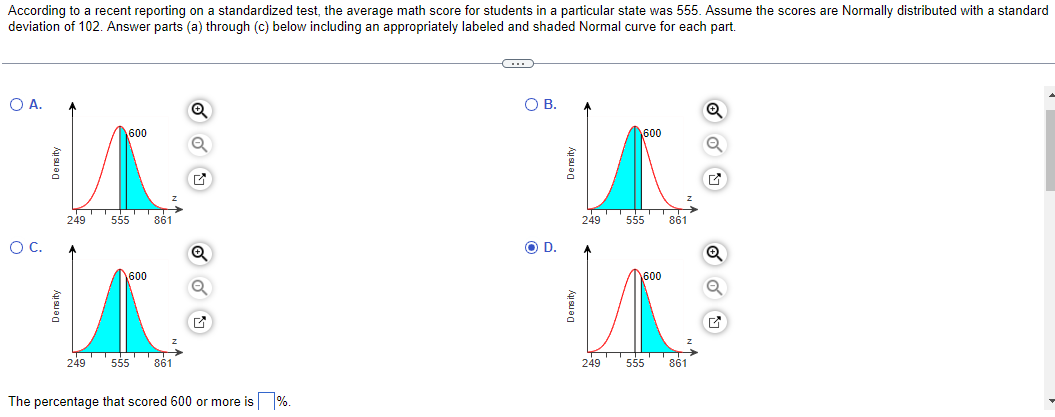
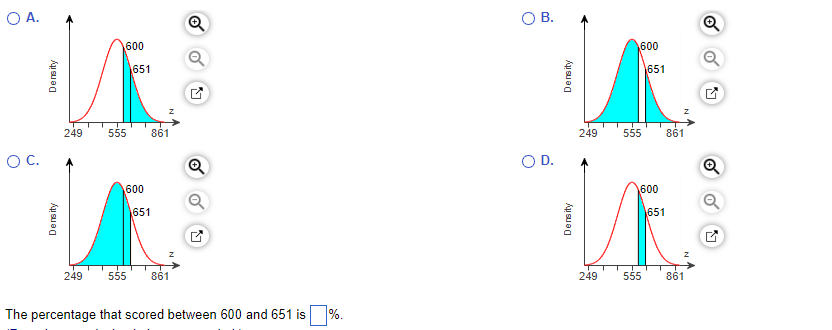
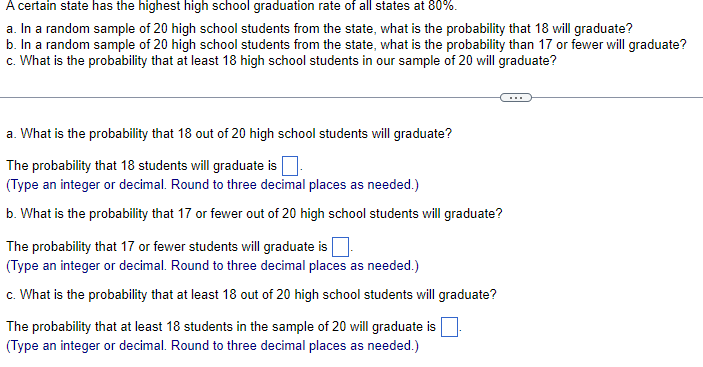
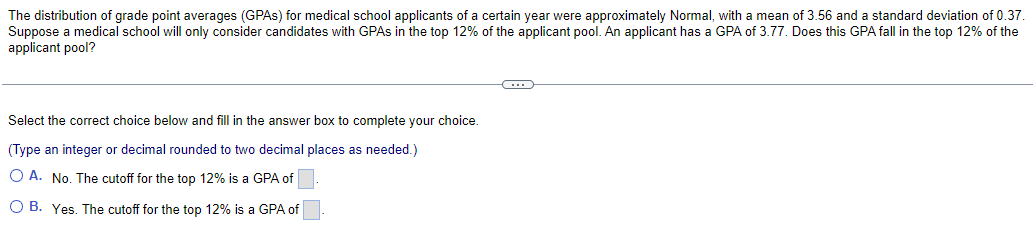
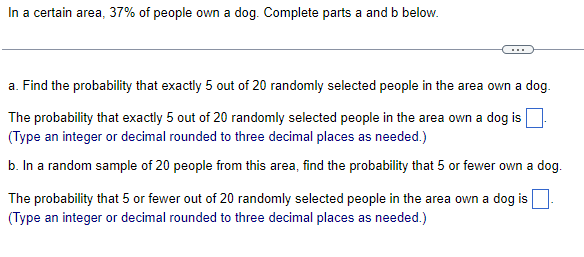
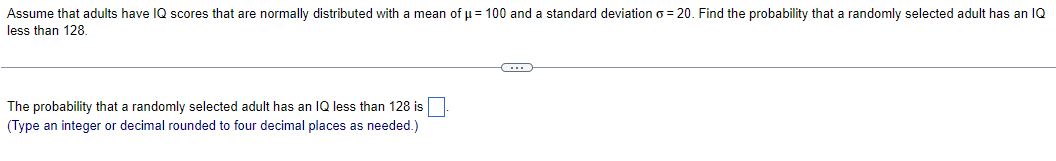
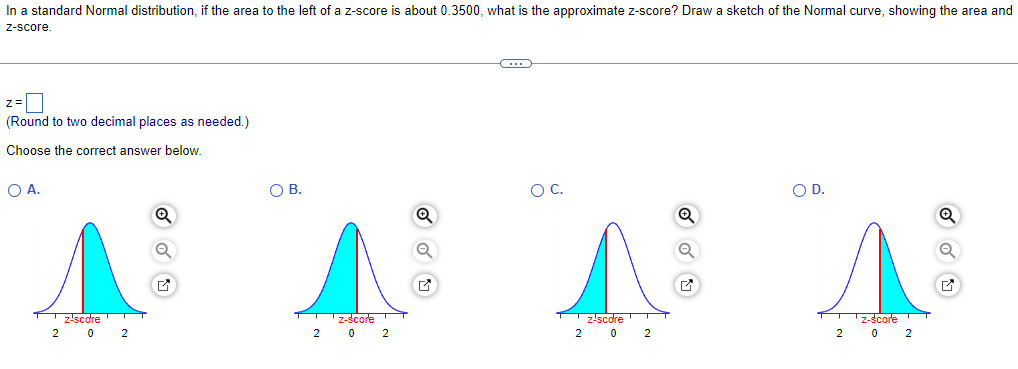
For each situation, identify the sample size n, the probability of a success p, and the number of successes x. When asked for the probability, state the answer in the form b(n,p,x). There is no need to give the numerical value of the probability. Assume the conditions for a binomial experiment are satisfied. Complete parts (a) and (b) below. a. A 2017 poll found that 52% of college students were very confident that their major will lead to a good job. If 20 college students are chosen at random, what's the probability that 13 of them were very confident their major would lead to a good job? Let a success be a college student being very confident their major would lead to a good job. The probability is b(n,p,x) = b(]].D (Type integers or decimals. Do not round.) b. A 2017 poll found that 52% of college students were very confident that their major will lead to a good job. If 20 college students are chosen at random, what's the probability that 15 of them are NOT confident that their major would lead to a good job? Let a success be a college student not being confident their major would lead to a good job. The probability is b(n,p,x) = b(]]D (Type integers or decimals. Do not round.)According to a recent reporting on a standardized test, the average math score for students in a particular state was 555. Assume the scores are Normally distributed with a standard deviation of 102. Answer parts (a) through (c) below including an appropriately labeled and shaded Normal curve for each part. O A. OB. 600 600 Density Density 249 555 861 249 555 861 O C. OD. 600 600 Density Density N 249 555 861 249 555 861 The percentage that scored 600 or more is %.O A. OB. 600 600 651 651 Density Density Ni 249 555 861 249 555 861 O C. OD. 600 600 651 651 Density Density IN 249 555 861 249 555 861 The percentage that scored between 600 and 651 is %Aeeltain state has the highest high school graduation rate of all states at 88%. a. In a random sample of28 high school students from the state. what is the probability that 18 will graduate? b. In a random sample of28 high school students from the state. what is the probability than 1]" or fewer will graduate? c. What is the probability that at least 18 high school students in our sample of28 will graduate? a. What is the probability that 18 out of28 high school students will graduate? The probability that 18 students will graduate is El. [Type an integer or decimal. Round to three decimal places as needed.) b. What is the probability that 1? or fewer out of 28 high school students will graduate? The probability that 1? or fewer students will graduate is E. [Type an integer or decimal. Round to three decimal places as needed.) :3. What is the probability that at least 18 out of 28 high school students will graduate? The probability that at least 18 students in the sample of 28 will graduate is E. [Type an integer or decimal. Round to three decimal places as needed.) The distribution of grade point averages (GPAs) for medical school applicants of a certain year were approximately Normal. with a mean of 3.56 and a standard deviation 0103?. Suppose a medical school will only consider candidates with GPAs in the top 12% of the applicant pool. An applicant has a GPA of 3.?1". Does this GPA fall in the top 12% of the applicant pool? Select the correct choice below and ll in the answer box to complete your choice. (Type an integer or decimal rounded to two decimal places as needed.) C1 A- No. The cutoffforthetop 12% is a GPA of [:1 3- Yes. The cutoff for the top 12% is a GPA of In a certain area, 37% of people own a dog. Complete parts a and b below a. Find the probability that exactly 5 out of 20 randomly selected people in the area own a dog. The probability that exactly 5 out of 20 randomly selected people in the area own a dog is (Type an integer or decimal rounded to three decimal places as needed.) b. In a random sample of 20 people from this area, find the probability that 5 or fewer own a dog. The probability that 5 or fewer out of 20 randomly selected people in the area own a dog is (Type an integer or decimal rounded to three decimal places as needed.)Assume that adults have IQ scores that are normally distributed with a mean ofp=10| and a standard deviation 0: 20. Find the probability.r that a randomly selected adult has an ID less than 128. (E) The probability that a randomly selected adult has an IQ less than 128 is (Type an integer or decimal rounded to four decimal places as needed.) z-score. In a standard Normal distribution, if the area to the left of a z-score is about 0.3500, what is the approximate z-score? Draw a sketch of the Normal curve, showing the area and Z= (Round to two decimal places as needed.) Choose the correct answer below. O A. O B. OC. OD. 2-score 2 0 2 Iz-score 2 0 2 2-score 2 0 2 z-score 2 0 2
Step by Step Solution
There are 3 Steps involved in it
Step: 1
Get Instant Access to Expert-Tailored Solutions
See step-by-step solutions with expert insights and AI powered tools for academic success
Step: 2
Step: 3
Ace Your Homework with AI
Get the answers you need in no time with our AI-driven, step-by-step assistance