

Answered step by step
Verified Expert Solution
Question
1 Approved Answer
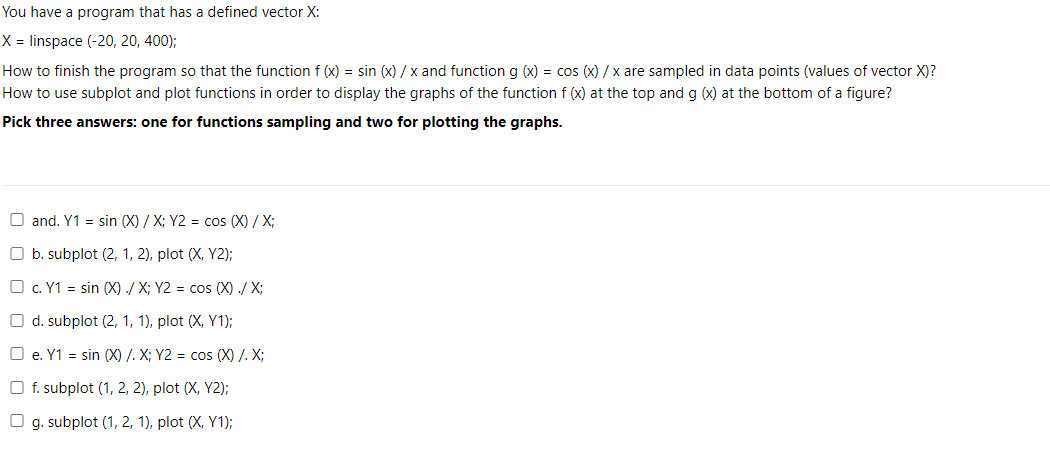
For Mathlab You have a program that has a defined vector X: X = linspace (-20, 20, 400); How to finish the program so that
For Mathlab
You have a program that has a defined vector X: X = linspace (-20, 20, 400); How to finish the program so that the function f(x) = sin(x)/x and function g (x) = cos(x)/x are sampled in data points (values of vector X)? How to use subplot and plot functions in order to display the graphs of the function f(x) at the top and g (x) at the bottom of a figure? Pick three answers: one for functions sampling and two for plotting the graphs. and. Y1 = sin (X) / X; Y2 = cos(X) / X; b. subplot (2, 1, 2), plot (X, Y2); O c.Y1 = sin (X)./X; Y2 = cos(X)./X; O d. subplot (2, 1, 1), plot (X, Y1); O e. Y1 = sin (X) /. X; Y2 = cos (X) /.X; f. subplot (1, 2, 2), plot (X, Y2); O g. subplot (1, 2, 1), plot (X, Y1)Step by Step Solution
There are 3 Steps involved in it
Step: 1

Get Instant Access to Expert-Tailored Solutions
See step-by-step solutions with expert insights and AI powered tools for academic success
Step: 2

Step: 3
Ace Your Homework with AI
Get the answers you need in no time with our AI-driven, step-by-step assistance
Get Started
Database And Transaction Processing
Authors: Philip M. Lewis, Arthur Bernstein, Michael Kifer
1st Edition
0201708728, 978-0201708721