Answered step by step
Verified Expert Solution
Link Copied!

Question

1 Approved Answer

For Questions 3 - 4 use the following information. The next figure shows the graphs of a marginal cost curve, a demand curve, and the
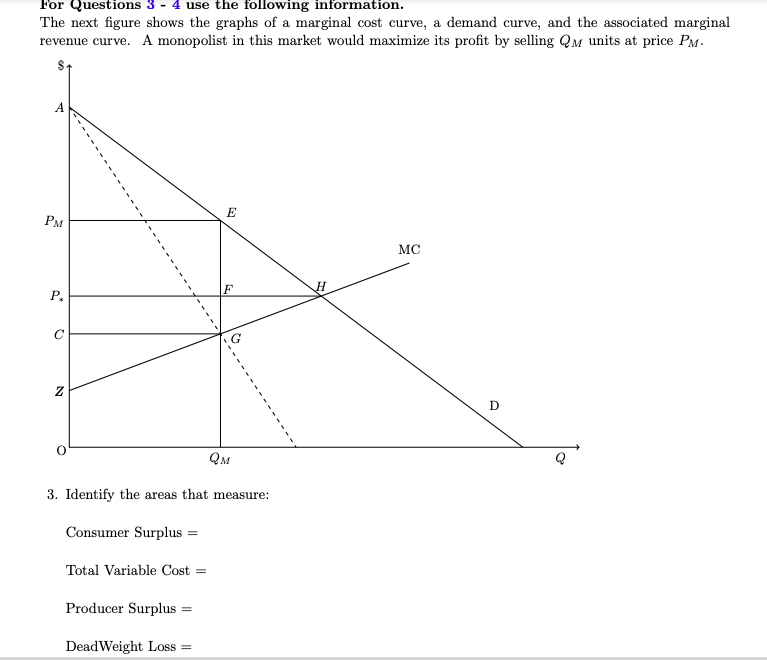
image text in transcribed
For Questions 3 - 4 use the following information. The next figure shows the graphs of a marginal cost curve, a demand curve, and the associated marginal revenue curve. A monopolist in this market would maximize its profit by selling Qar units at price PM. S A E PM MC Q Z D QM Q 3. Identify the areas that measure: Consumer Surplus = Total Variable Cost = Producer Surplus = DeadWeight Loss =

Step by Step Solution

There are 3 Steps involved in it

Step: 1

blur-text-image

Get Instant Access to Expert-Tailored Solutions

See step-by-step solutions with expert insights and AI powered tools for academic success

Step: 2

blur-text-image_2

Step: 3

blur-text-image_3

Ace Your Homework with AI

Get the answers you need in no time with our AI-driven, step-by-step assistance

Get Started

Recommended Textbook for

Strategic Management And Business Policy Toward Global Sustainability

Authors: Thomas L. Wheelen, J. David Hunger

13th Edition

9780132998079, 132998076, 978-0132153225

More Books

Students also viewed these Economics questions

Question

Discuss the states of accounting

Answered: 1 week ago