For the developed trend regression, perform the following tests and determine if the results are significant.
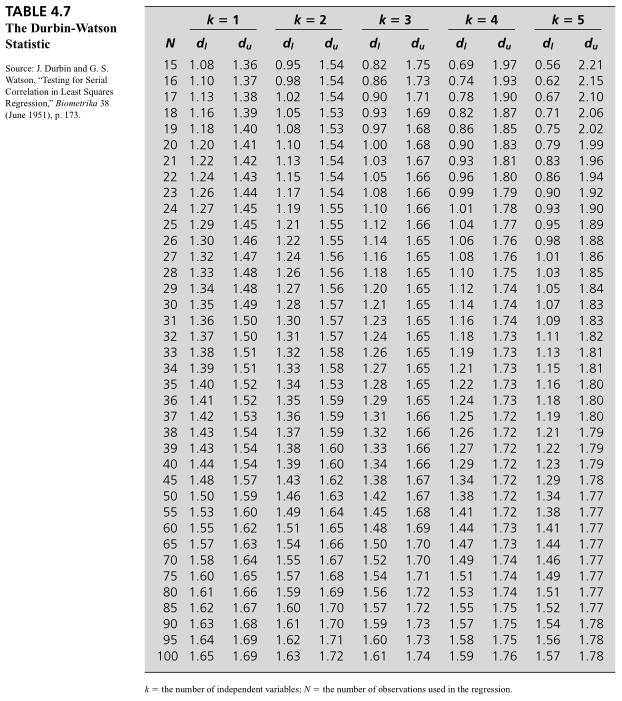
Test for the existence ofserial correlationin the trend regression. The DW test statistic is as follows:
TABLE 4.7 k = 1 The Durbin-Watson k = 2 k = 3 k = 4 k = 5 Statistic N du di du di du du di du Source: J. Durbin and G. S. 15 1.08 1.36 0.95 1.54 0.82 1.75 0.69 1.97 0.56 2.21 Watson, "Testing for Serial 16 1.10 1.37 0.98 1.54 0.86 1.73 0.74 1.93 Correlation in Least Squares 0.62 2.15 Regression," Biometrika 38 17 1.13 1.38 1.02 1.54 0.90 1.71 0.78 1.90 0.67 2.10 (June 1951), p. 173 18 1.16 1.39 1.05 1.53 0.93 1.69 0.82 1.87 0.71 2.06 19 1.18 1.40 1.08 1.53 0.97 1.68 0.86 1.85 0.75 2.02 20 1.20 1.41 1.10 1.54 1.00 1.68 0.90 1.83 0.79 1.99 21 1.22 1.42 1.13 1.54 1.03 1.67 0.93 1.81 0.83 1.96 22 1.24 1.43 1.15 1.54 1.05 1.66 0.96 1.80 0.86 1.94 1.26 1.44 1.17 1.54 1.08 1.66 0.99 1.79 0.90 1.92 24 1.27 1.45 1.19 1.55 1.10 1.66 1.01 1.78 0.93 1.90 25 1.29 1.45 1.21 1.55 1.12 1.66 1.04 1.77 0.95 1.89 26 1.30 1.46 1.22 1.55 1.14 1.65 1.06 1.76 0.98 1.88 27 1.32 1.47 1.24 1.56 1.16 1.65 1.08 1.76 1.01 1.86 28 1.33 1.48 1.26 1.56 1.18 1.65 1.10 1.75 1.03 1.85 1.34 1.48 1.27 1.56 1.20 1.65 1.12 1.74 1.05 1.84 30 1.35 1.49 1.28 1.57 1.21 1.65 1.14 1.74 1.07 1.83 31 1.36 1.50 1.30 1.57 1.23 1.65 1.16 1.74 1.09 1.83 32 1.37 1.50 1.31 1.57 1.24 1.65 1.18 1.73 1.11 1.82 33 1.38 1.51 1.32 1.58 1.26 1.65 1.19 1.73 1.13 1.81 34 1.39 1.51 1.33 1.58 1.27 1.65 1.21 1.73 1.15 1.81 35 1.40 1.52 1.34 1.53 1.28 1.65 1.22 1.73 1.16 1.80 36 1.41 1.52 1.35 1.59 1.29 1.65 1.24 1.73 1.18 1.80 37 1.42 1.53 1.36 1.59 1.31 1.66 1.25 1.72 1.19 1.80 38 1.43 1.54 1.37 1.59 1.32 1.66 1.26 1.72 1.21 1.79 1.43 1.54 1.38 1.60 1.33 1.66 1.27 1.72 1.22 1.79 40 1.44 1.54 1.39 1.60 1.34 1.66 1.29 1.72 1.23 1.79 45 1.48 1.57 1.43 1.62 1.38 1.67 1.34 1.72 1.29 1.78 50 1.50 1.59 1.46 1.63 1.42 1.67 1.38 1.72 1.34 1.77 55 1.53 1.60 1.49 1.64 1.45 1.68 1.41 1.72 1.38 1.77 60 1.55 1.62 1.51 1.65 1.48 1.69 1.44 1.73 1.41 1.77 65 1.57 1.63 1.54 1.66 1.50 1.70 1.47 1.73 1.44 1.77 70 1.58 1.64 1.55 1.67 1.52 1.70 1.49 1.74 1.46 1.77 75 1.60 1.65 1.57 1.68 1.54 1.71 1.51 1.74 1.49 1.77 80 1.61 1.66 1.59 1.69 1.56 1.72 1.53 1.74 1.51 1.77 85 1.62 1.67 1.60 1.70 1.57 1.72 1.55 1.75 1.52 1.77 90 1.63 1.68 1.61 1.70 1.59 1.73 1.57 1.75 1.54 1.78 95 1.64 1.69 1.62 1.71 1.60 1.73 1.58 1.75 1.56 1.78 100 1.65 1.69 1.63 1.72 1.61 1.74 1.59 1.76 1.57 1.78 * = the number of independent variables; N = the number of observations used in the regression


