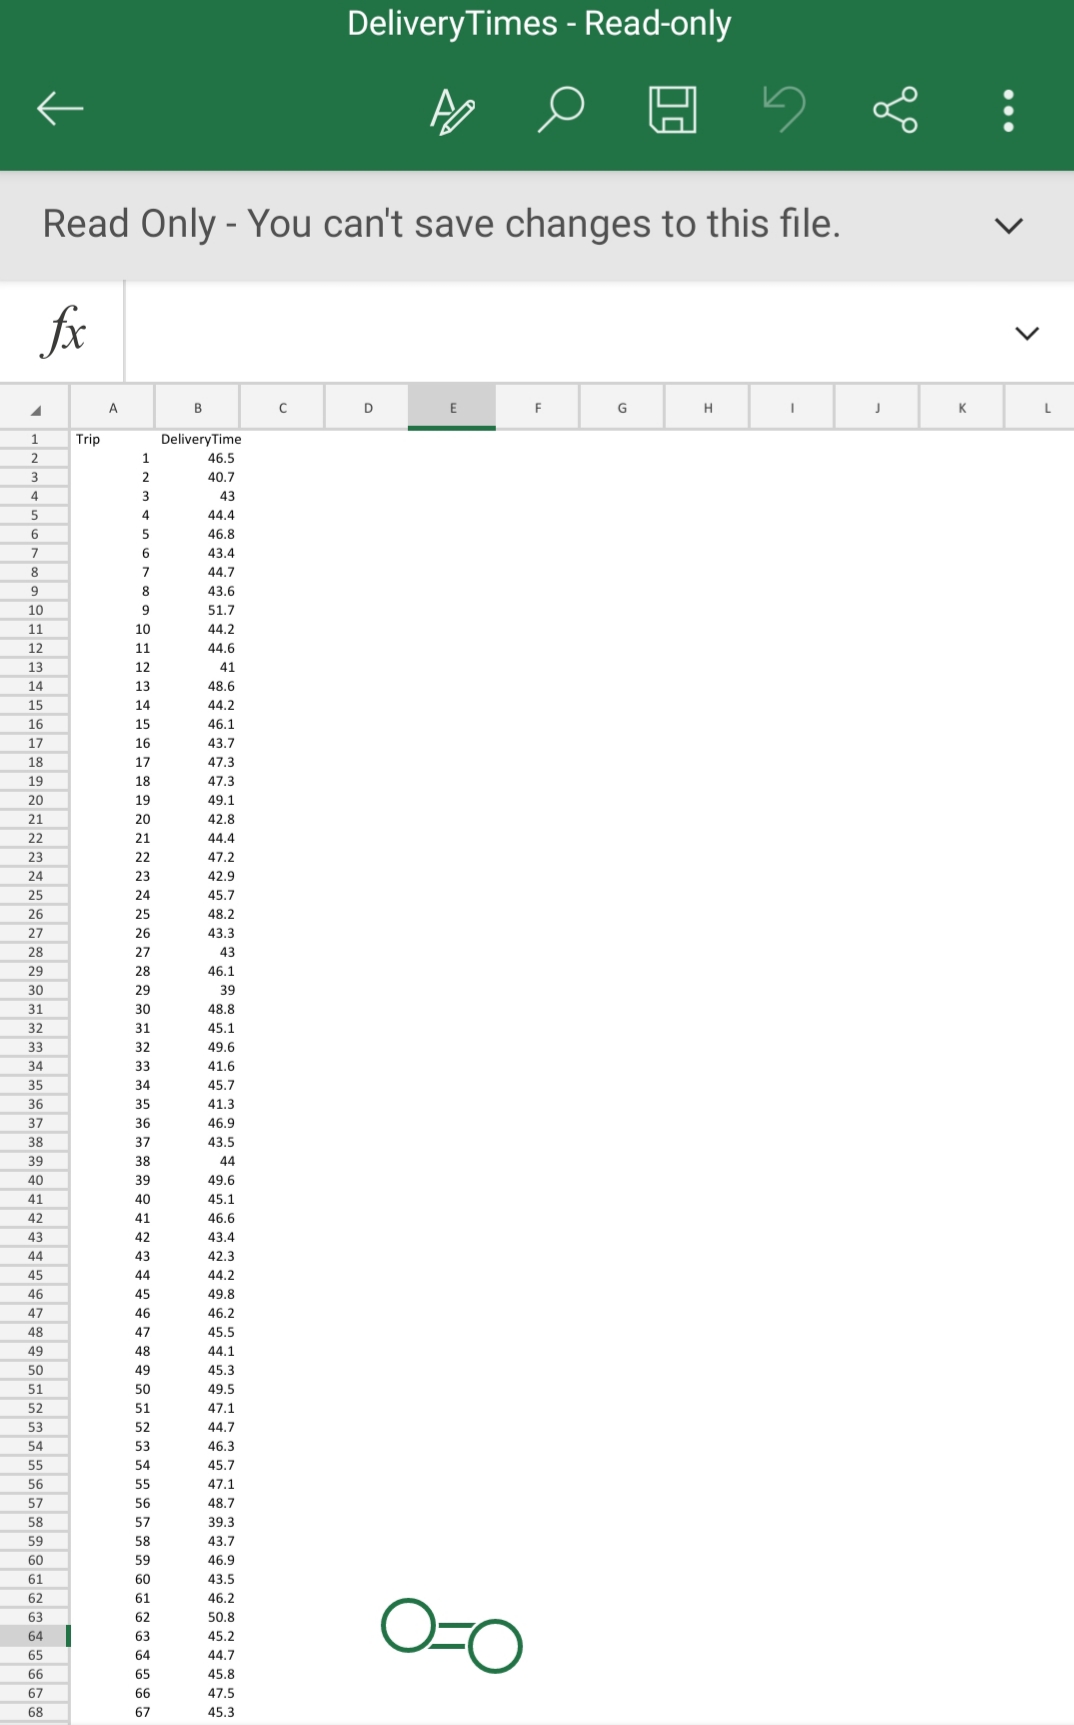
For the excel sheet data , You can take only first 15 values, to carry out your calculations.
Kindly address all parts of the question properly.
Thanks in advance.
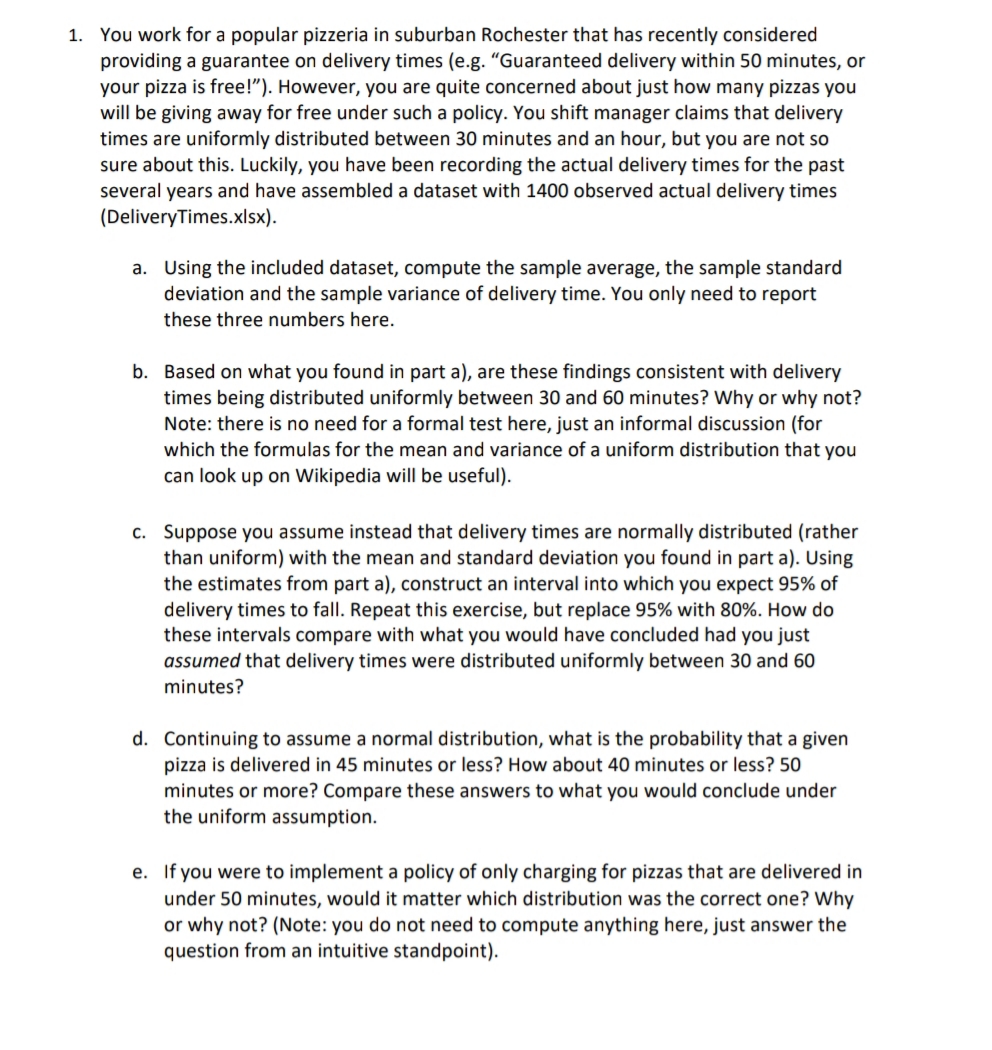
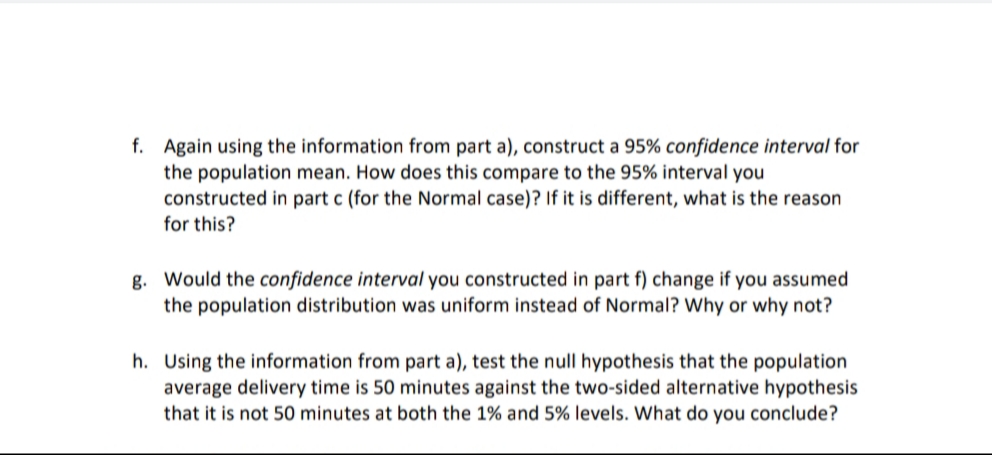
DeliveryTimes - Read-only 14 . . . Read Only - You can't save changes to this file. V fx V E G H K Trip Delivery Time DONGUAWNA 46.5 40.7 43 44.4 46.8 43.4 44.7 43.6 51.7 10 44.2 11 14.6 12 41 13 48.6 14 44.2 15 46.1 16 43.7 17 47.3 18 47.3 19 49.1 20 42.8 21 44.4 22 47.2 23 42.9 24 45.7 25 48.2 26 43.3 27 43 28 46.1 29 39 30 48.8 31 45.1 32 49.6 33 41.6 34 45.7 35 41.3 36 46.9 37 43.5 38 44 39 49.6 40 45.1 41 46.6 42 43.4 43 42.3 44 44.2 45 49.8 46 46.2 47 45.5 48 44.1 49 45.3 50 49.5 47.1 44.7 46.3 45.7 47.1 48.7 39.3 43.7 46.9 43.5 46.2 50.8 45.2 44.7 OO 45.8 17.5 45.31. You work for a popular pizzeria in suburban Rochester that has recently considered providing a guarantee on delivery times (e.g. "Guaranteed delivery within 50 minutes, or y0ur pizza is free!"). Hawever, you are Quite Concerned aboutjust how many pizzas you will be giving away for free under such a policy. You shift manager claims that delivery times are uniformly distributed between 30 minutes and an hour, but you are not so sure about this. Luckily, you have been recording the actual delivery times for the past several years and have assembled a dataset with 1400 observed actual delivery times (DeliveryTimes.xlsx). 3. Using the included dataset, compute the sample average, the sample standard deviation and the sample variance of delivery time. You only need to report these three numbers here. b. Based on what you found in part a), are these ndings consistent with delivery times being distributed uniformly between 30 and 60 minutes? Why or why not? Note: there is no need for a formal test here, just an informal discussion (for which the formulas for the mean and variance of a uniform distribution that you can look up on Wikipedia will be useful}. c. Suppose you assume instead that delivery times are normally distributed [rather than uniform) with the mean and standard deviation you found in part a). Using the estimates from part a), construct an interval into which you expect 95% of delivery times to fall. Repeat this exercise, but replace 95% with 80%. How do these intervals compare with what you would have concluded had you just assumed that delivery times were distributed uniformly between 30 and 60 minutes? d. Continuing to assume a normal distribution, what is the probability that a given pizza is delivered in 45 minutes or less? How about 40 minutes or less? 50 minutes or more? Compare these answers to what you would conclude under the uniform assumption. e. If you were to implement a policy of only charging for pizzas that are delivered in under 50 minutes, would it matter which distribution was the correct one? Why or why not? (Note: you do not need to compute anything here, just answer the question from an intuitive standpoint). f. Again using the information from part a), construct a 95% confidence interval for the population mean. How does this compare to the 95% interval you constructed in part c (for the Normal case)? If it is different, what is the reason for this? g. Would the confidence interval you constructed in part f) change if you assumed the population distribution was uniform instead of Normal? Why or why not? h. Using the information from part a), test the null hypothesis that the population average delivery time is 50 minutes against the two-sided alternative hypothesis that it is not 50 minutes at both the 1% and 5% levels. What do you conclude