Answered step by step
Verified Expert Solution
Question
1 Approved Answer
For the final question, assume that the peak of the normal distribution is at the same position as the peak of the actual data (i.e.,
For the final question, assume that the peak of the normal distribution is at the same position as the peak of the actual data (i.e., at = 1.8 mol/m^3). Thanks!
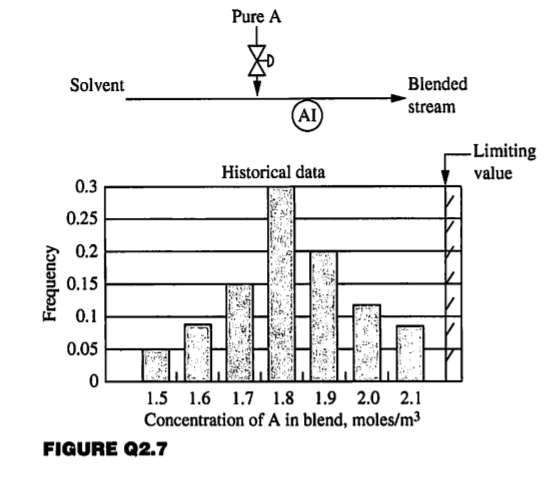
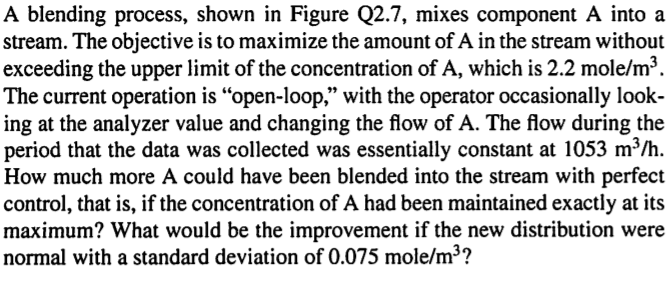
A blending process, shown in Figure Q2.7, mixes component A into a stream. The objective is to maximize the amount of A in the stream without exceeding the upper limit of the concentration of A, which is 2.2 mole/m3. The current operation is open-loop, with the operator occasionally look- ing at the analyzer value and changing the flow of A. The flow during the period that the data was collected was essentially constant at 1053 m/h. How much more A could have been blended into the stream with perfect control, that is, if the concentration of A had been maintained exactly at its maximum? What would be the improvement if the new distribution were normal with a standard deviation of 0.075 mole/m3? Pure A Solvent Blended stream AI) Historical data -Limiting value 0.3 0.25 0.2 Frequency 0.15 0.1 0.05 0 1.5 1.6 1.7 1.8 1.9 2.0 2.1 Concentration of A in blend, moles/m3 FIGURE Q2.7 Consider further the system Suppose that it were possible to develop a process with frequency data that possessed a normal distribution with a peak at 1.9 mol/m and a standard deviation of 0.1 mol/m. Would this process satisfy soft or hard safety constraints? What is the projected improvement in output over the actual dataStep by Step Solution
There are 3 Steps involved in it
Step: 1
Get Instant Access to Expert-Tailored Solutions
See step-by-step solutions with expert insights and AI powered tools for academic success
Step: 2
Step: 3
Ace Your Homework with AI
Get the answers you need in no time with our AI-driven, step-by-step assistance
Get Started